Image to SVGConvert Research Images into Editable SVG
Upload a PNG, JPG, screenshot, or research figure reference and turn it into a clean SVG-style diagram you can refine. FigEditor is built for academic visuals where labels, arrows, panels, and structure matter more than generic raster tracing.
Generate Editable Scientific Figures
Turn method text into a publication-ready SVG figure. Preview the PNG, download the assets, then open the editor only when you need to refine it. Generating one SVG scientific illustration typically takes about 5-10 minutes.
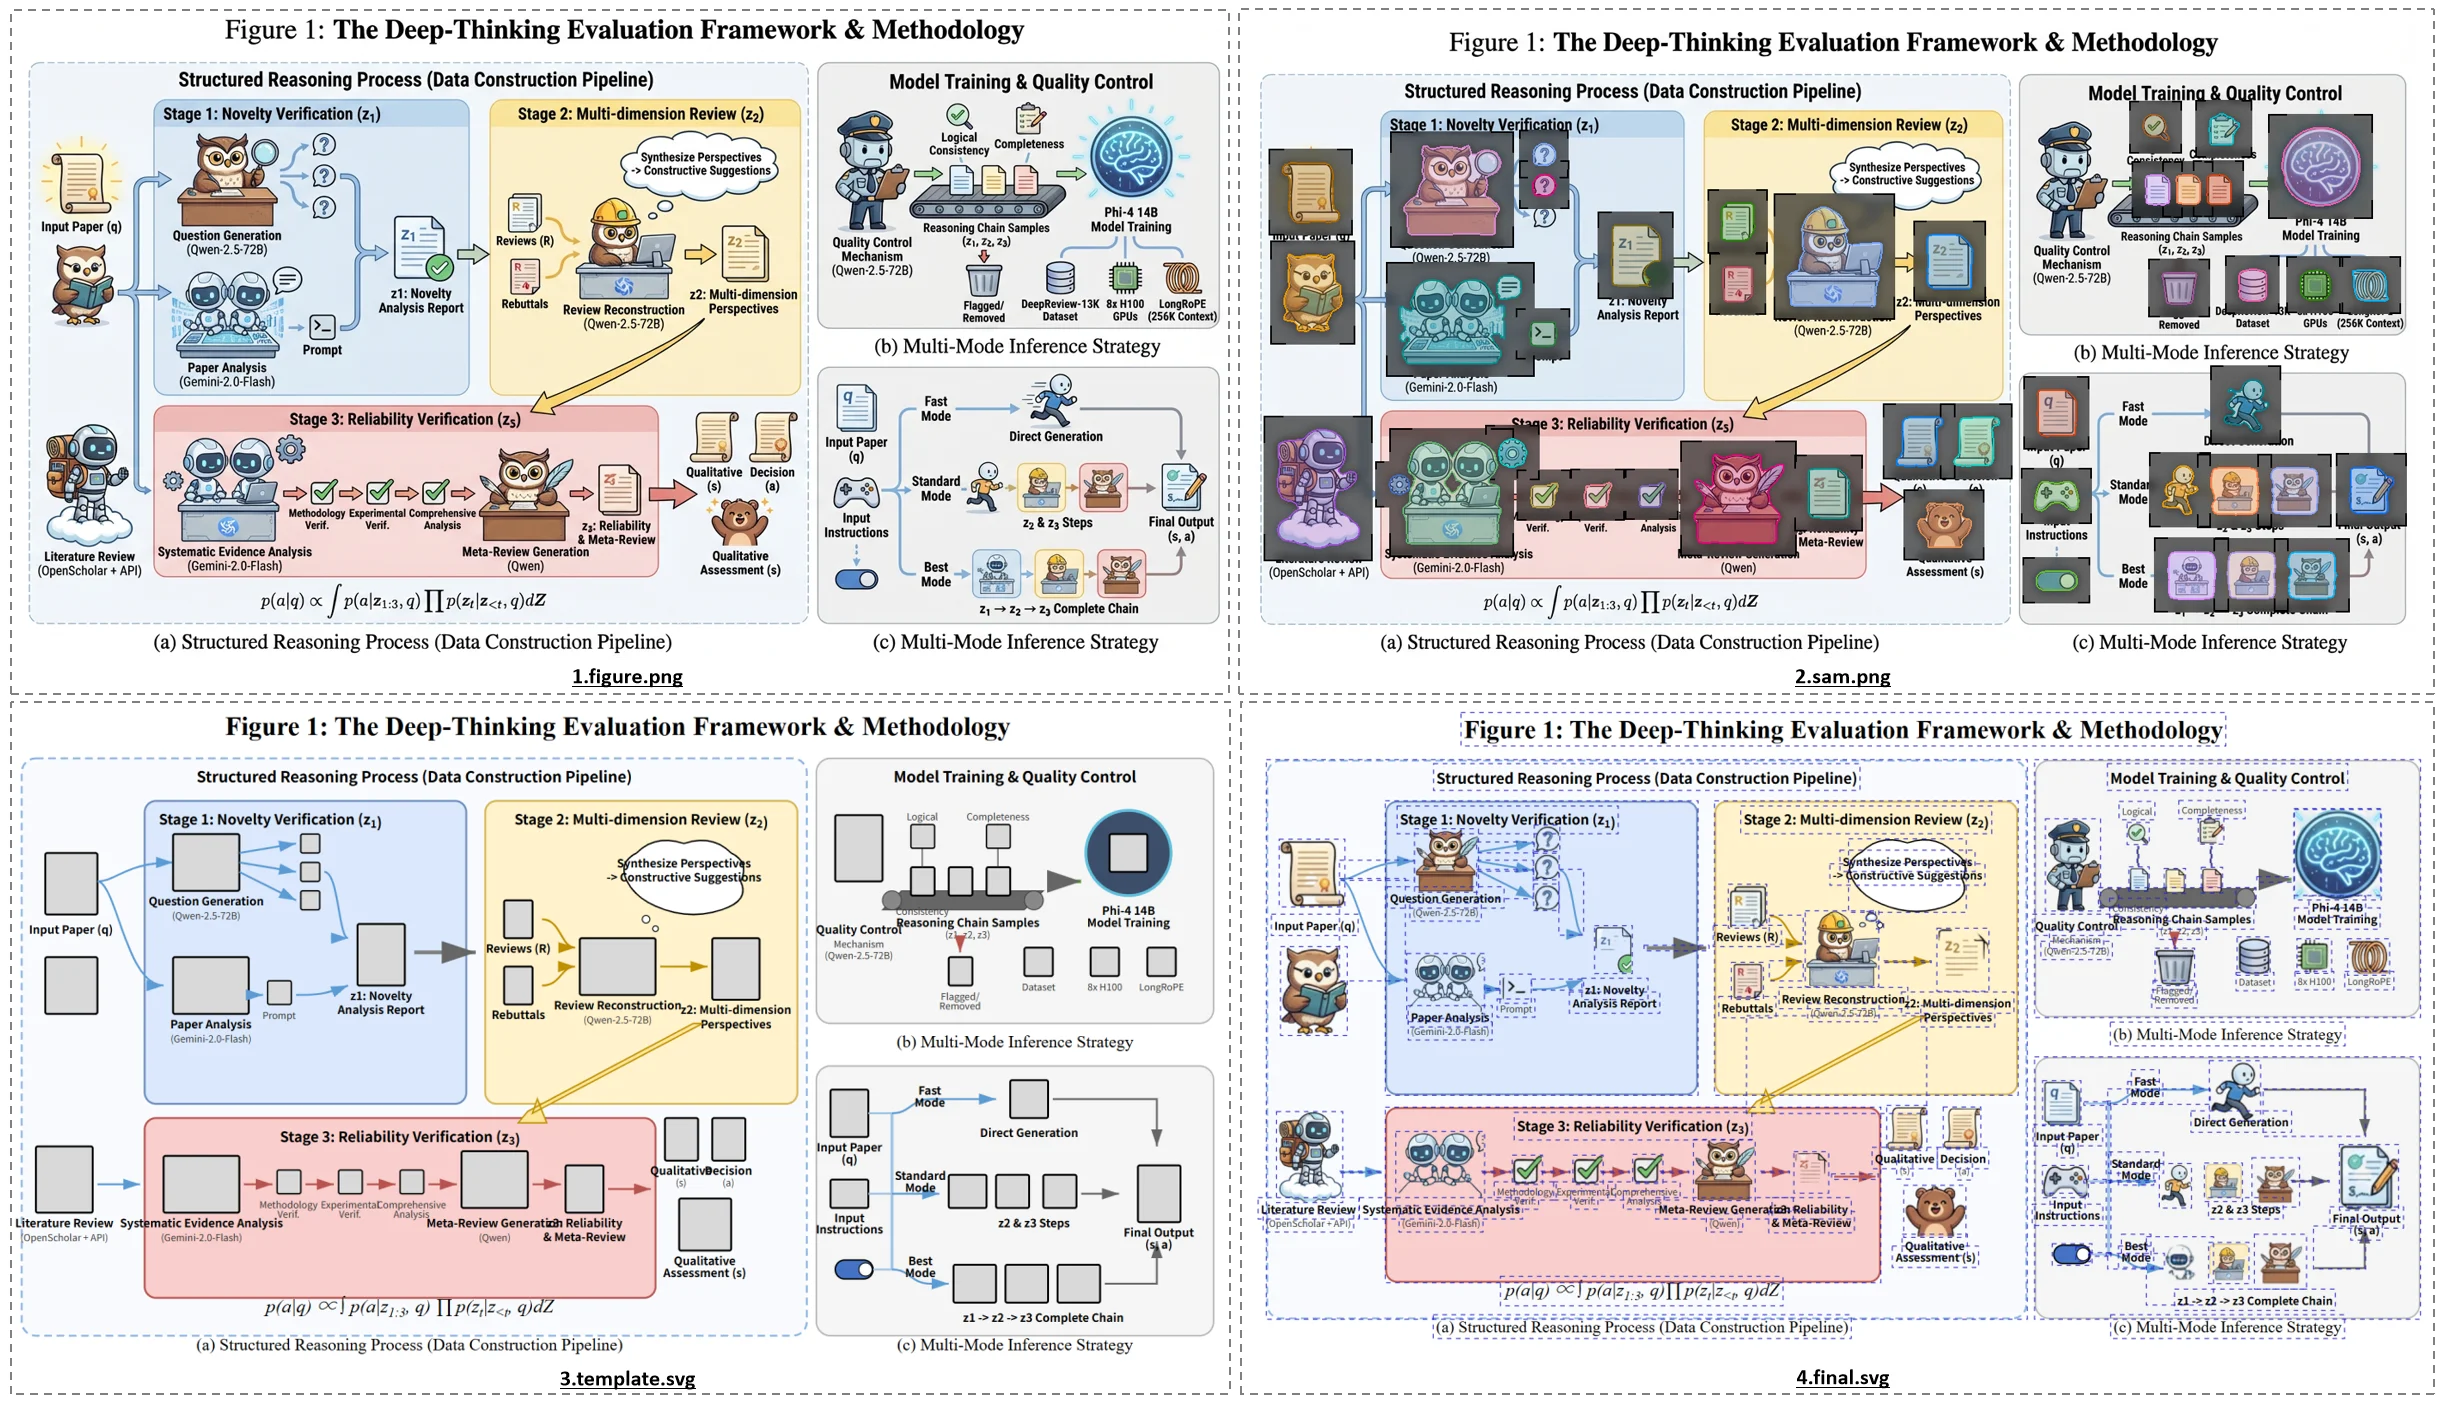
Image-to-SVG Showcase
What Is Image to SVG?
Reference-Based Re-creation
Upload an image as a visual reference and let FigEditor rebuild the diagram instead of tracing every pixel
Cleaner Labels and Layers
Keep diagrams easier to edit by preserving labels, shapes, arrows, and panels as meaningful structure
Research-Ready Output
Create scalable visuals for manuscripts, slides, posters, reports, and academic diagrams
FigEditor Capabilities
Why Use FigEditor for Image to SVG?
Most image-to-SVG converters are built for logos, icons, Cricut files, or simple clipart. FigEditor focuses on research visuals where semantic structure matters.
AI Re-creation, Not Pixel Tracing
Inkscape Trace and generic tools often produce dirty path-based output. FigEditor rebuilds the figure as a structured academic visual.
Works with Real Research Images
Use screenshots, paper figures, pathway images, schematic diagrams, and architecture visuals as references.
Editable SVG Vector Output
Create scalable SVG-style output that can be refined in Illustrator, Inkscape, draw.io, or FigEditor's built-in editor.
Avoid Broken Text and Blobby Paths
Reduce the common converter problems: jagged paths, flattened text, merged colors, lost transparency, and huge SVG files.
5-Step AI Pipeline
Generator, Segmenter, Extractor, Assembler, and Optimizer work together to make the SVG cleaner and easier to edit.
How FigEditor Converts an Image to Editable SVG
Upload an Image or Describe It
AI Rebuilds the Diagram
Download Editable SVG or High-Res PNG
Each step moves the image closer to a clean SVG diagram
Instead of returning a bloated trace, FigEditor generates a draft, detects visual elements, extracts clean components, builds a structured SVG template, and assembles the final editable visual.
Image to SVG for Research Visuals
Biology & Medicine
Convert pathway screenshots, signaling diagrams, anatomical schematics, and clinical workflow images into cleaner editable SVG-style visuals.
Computer Science & AI
Re-create model pipeline screenshots, system architecture images, and ML workflow diagrams as structured SVG drafts you can edit.
Chemistry & Materials
Turn reaction mechanism images, synthesis workflows, and materials process diagrams into scalable visuals for papers and presentations.
Physics & Engineering
Convert experimental setup images, optical path screenshots, and engineering schematics into SVG-style diagrams for editing.
Earth & Environmental Science
Rebuild geology, climate, ecosystem, and geospatial process images as cleaner diagrams for posters, reports, and journals.
Statistics & Data Science
Convert methodology images, data pipeline diagrams, and statistical model schematics into editable SVG-style outputs with clearer structure.
Trusted by Scientists Worldwide
From PhD students to principal investigators, researchers use FigEditor to ship publication-ready figures faster.
I used to spend an entire afternoon redrawing pathway diagrams in Illustrator. FigEditor gives me a publication-ready figure in under a minute.
The architecture diagrams are clean enough that my advisor actually approved the first draft. That has literally never happened before.
We replaced our paid BioRender subscription for the lab. FigEditor handles 80% of our figures and the editing workflow is faster.
Graphical abstracts used to be the worst part of submission. Now I generate three options in 5 minutes and pick one.
Finally an AI tool that produces vector-quality scientific figures, not blurry slop. The SVG export is exactly what journals want.
English isn't my first language, but FigEditor understands my technical descriptions and renders the diagram correctly every time.
Image to SVG — Frequently Asked Questions
Answers about converting PNG, JPG, screenshots, and research figures into editable SVG-style visuals
Generate Your First AI Scientific Illustration
Stop juggling Illustrator, BioRender, and PowerPoint. The FigEditor AI scientific illustration suite turns prompts into journal-ready diagrams, papers and images into editable SVG vectors, and lets you refine every output in the in-browser editor — free to start. Posters and slides coming soon.
No credit card required · Free credits on signup