Scientific Diagram MakerFrom Text to Editable SVG in Minutes
Describe your pathway, workflow, method, mechanism, or research concept. FigEditor.ai generates publication-ready scientific diagrams you can refine with prompts and export as clean visuals for papers, theses, posters, and slides.
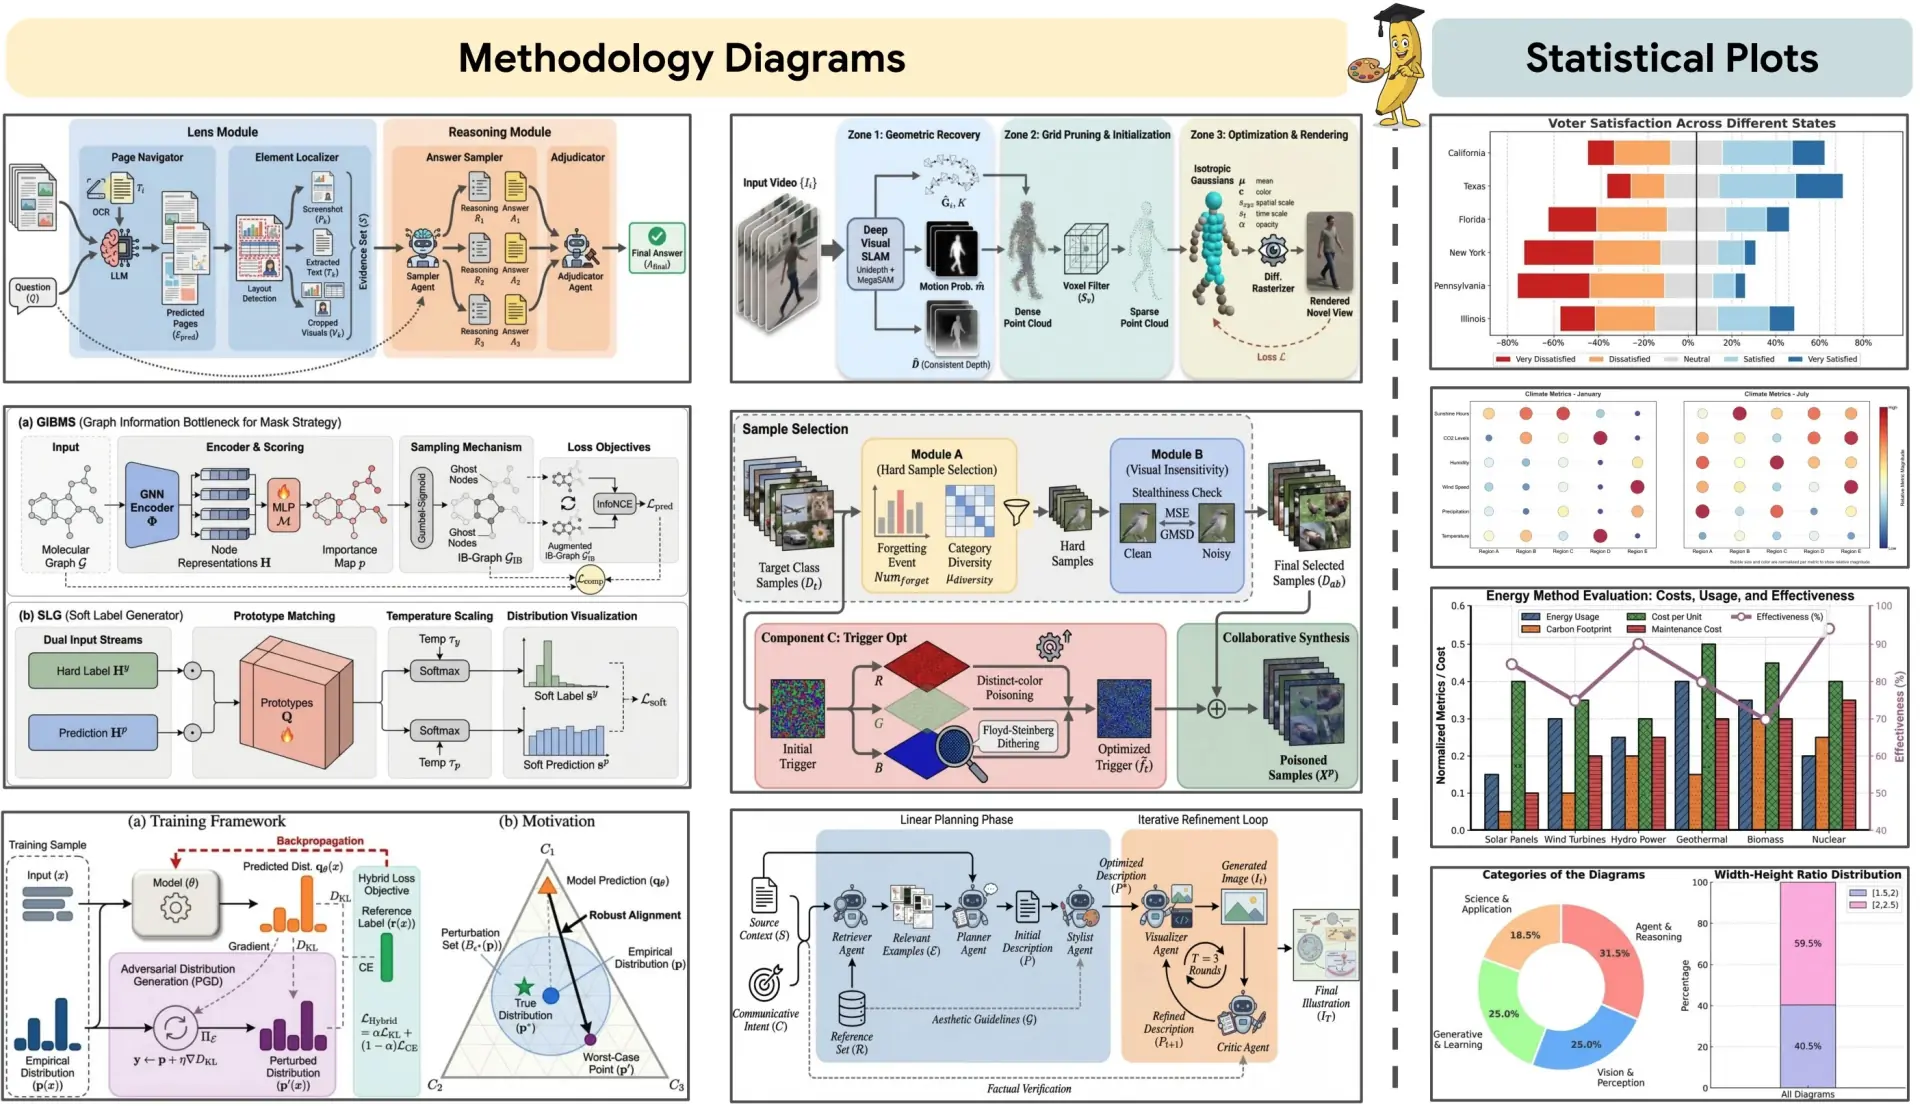
FigEditor Pipeline
Turn methodology text into publication-ready architecture diagrams, statistical plots, or image edits via Nano Banana Pro.
Diagram mode uses asynchronous task generation (submit task, poll status, then return final image). Generating one scientific illustration typically takes about 5 minutes.
Text to Scientific Diagram
Paste a study summary, protocol, pathway, or methods paragraph and generate a visual draft.
Scientific Visual Conventions
Use labels, arrows, grouping, flow, hierarchy, and domain-aware structure instead of starting from a blank canvas.
Research-Ready Output
Create visuals suitable for manuscripts, theses, posters, presentations, lectures, and lab communication.
Scientific Diagram Inputs
Scientific Diagrams for Researchers, Not Designers
Most researchers need a clear diagram, not another design tool to master. FigEditor.ai focuses on scientific diagram creation from real research content.
Built for Scientific Structure
Start with research-oriented layouts for pathways, methods, mechanisms, networks, and schematic explanations.
From Text to Visual
Convert abstracts, methods, protocols, and paper summaries into clear diagram layouts.
No Illustrator Required
Avoid expensive software and long tutorials when you just need a polished scientific visual.
Fast Review Feedback Loops
Regenerate directions quickly when a co-author, advisor, or reviewer asks for a clearer diagram.
Scientific Visual Language
Use diagrams with labels, arrows, visual grouping, and structure made for research communication.
Text to Diagram
Convert a paragraph of research text into a scientific diagram that highlights the components, relationships, and main takeaway.
Paper or PDF Context
Use paper content as context so the generated visual reflects your real experiment, method, and contribution.
Sketch to Schematic
Turn a rough lab sketch or whiteboard idea into a cleaner diagram direction.
Repurpose Existing Figures
Use prior diagrams or result visuals as references when you need a cleaner, more consistent version.
Methods to Schematic
Transform methods text into an explanatory workflow diagram that readers can understand quickly.
Biology and Molecular Pathway Diagrams
Describe signaling pathways, cell interactions, gene regulation, or disease mechanisms and generate a clear scientific diagram draft.
Biology and Molecular Pathway Diagrams Demo
Choose the Scientific Diagram You Need
Biology and Molecular Pathway Diagrams
Describe signaling pathways, cell interactions, gene regulation, or disease mechanisms and generate a clear scientific diagram draft.
Research Method and Protocol Workflows
Turn methods text, experimental protocols, or computational pipelines into step-by-step workflow diagrams for papers and theses.
Mechanism and Concept Schematics
Explain hypotheses, mechanisms, conceptual models, and system behavior with a structured schematic instead of a blank slide.
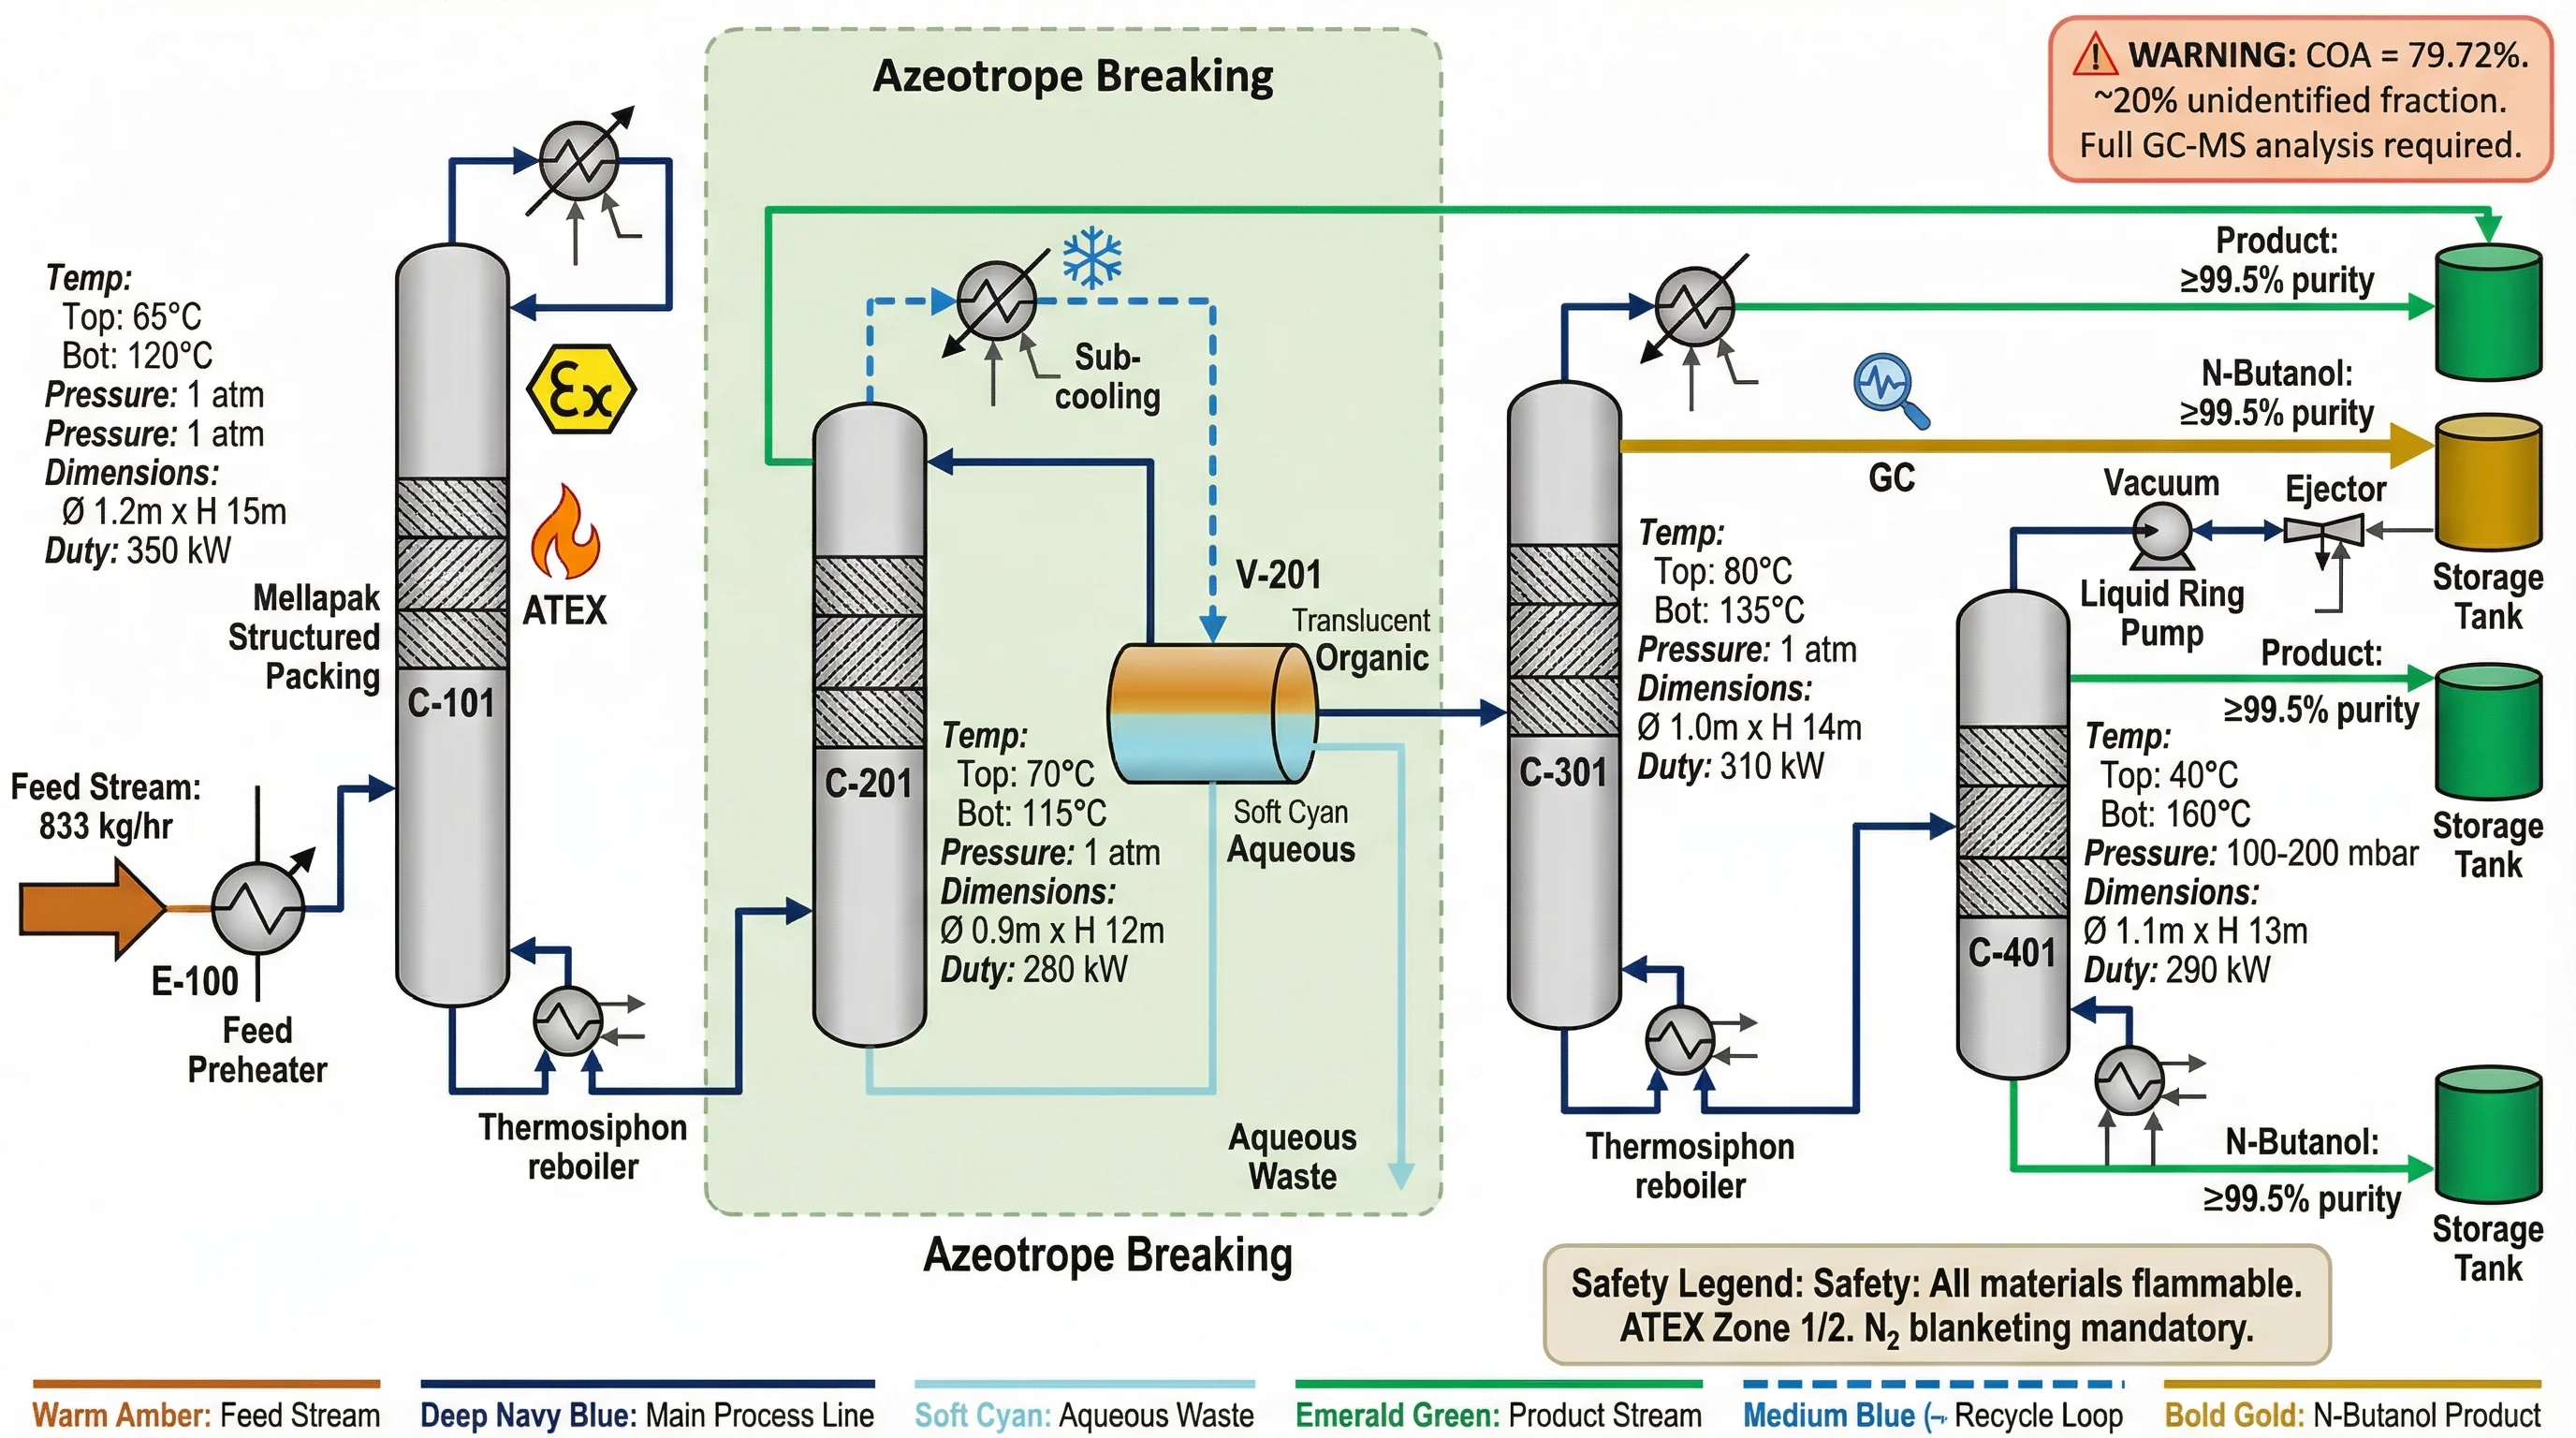
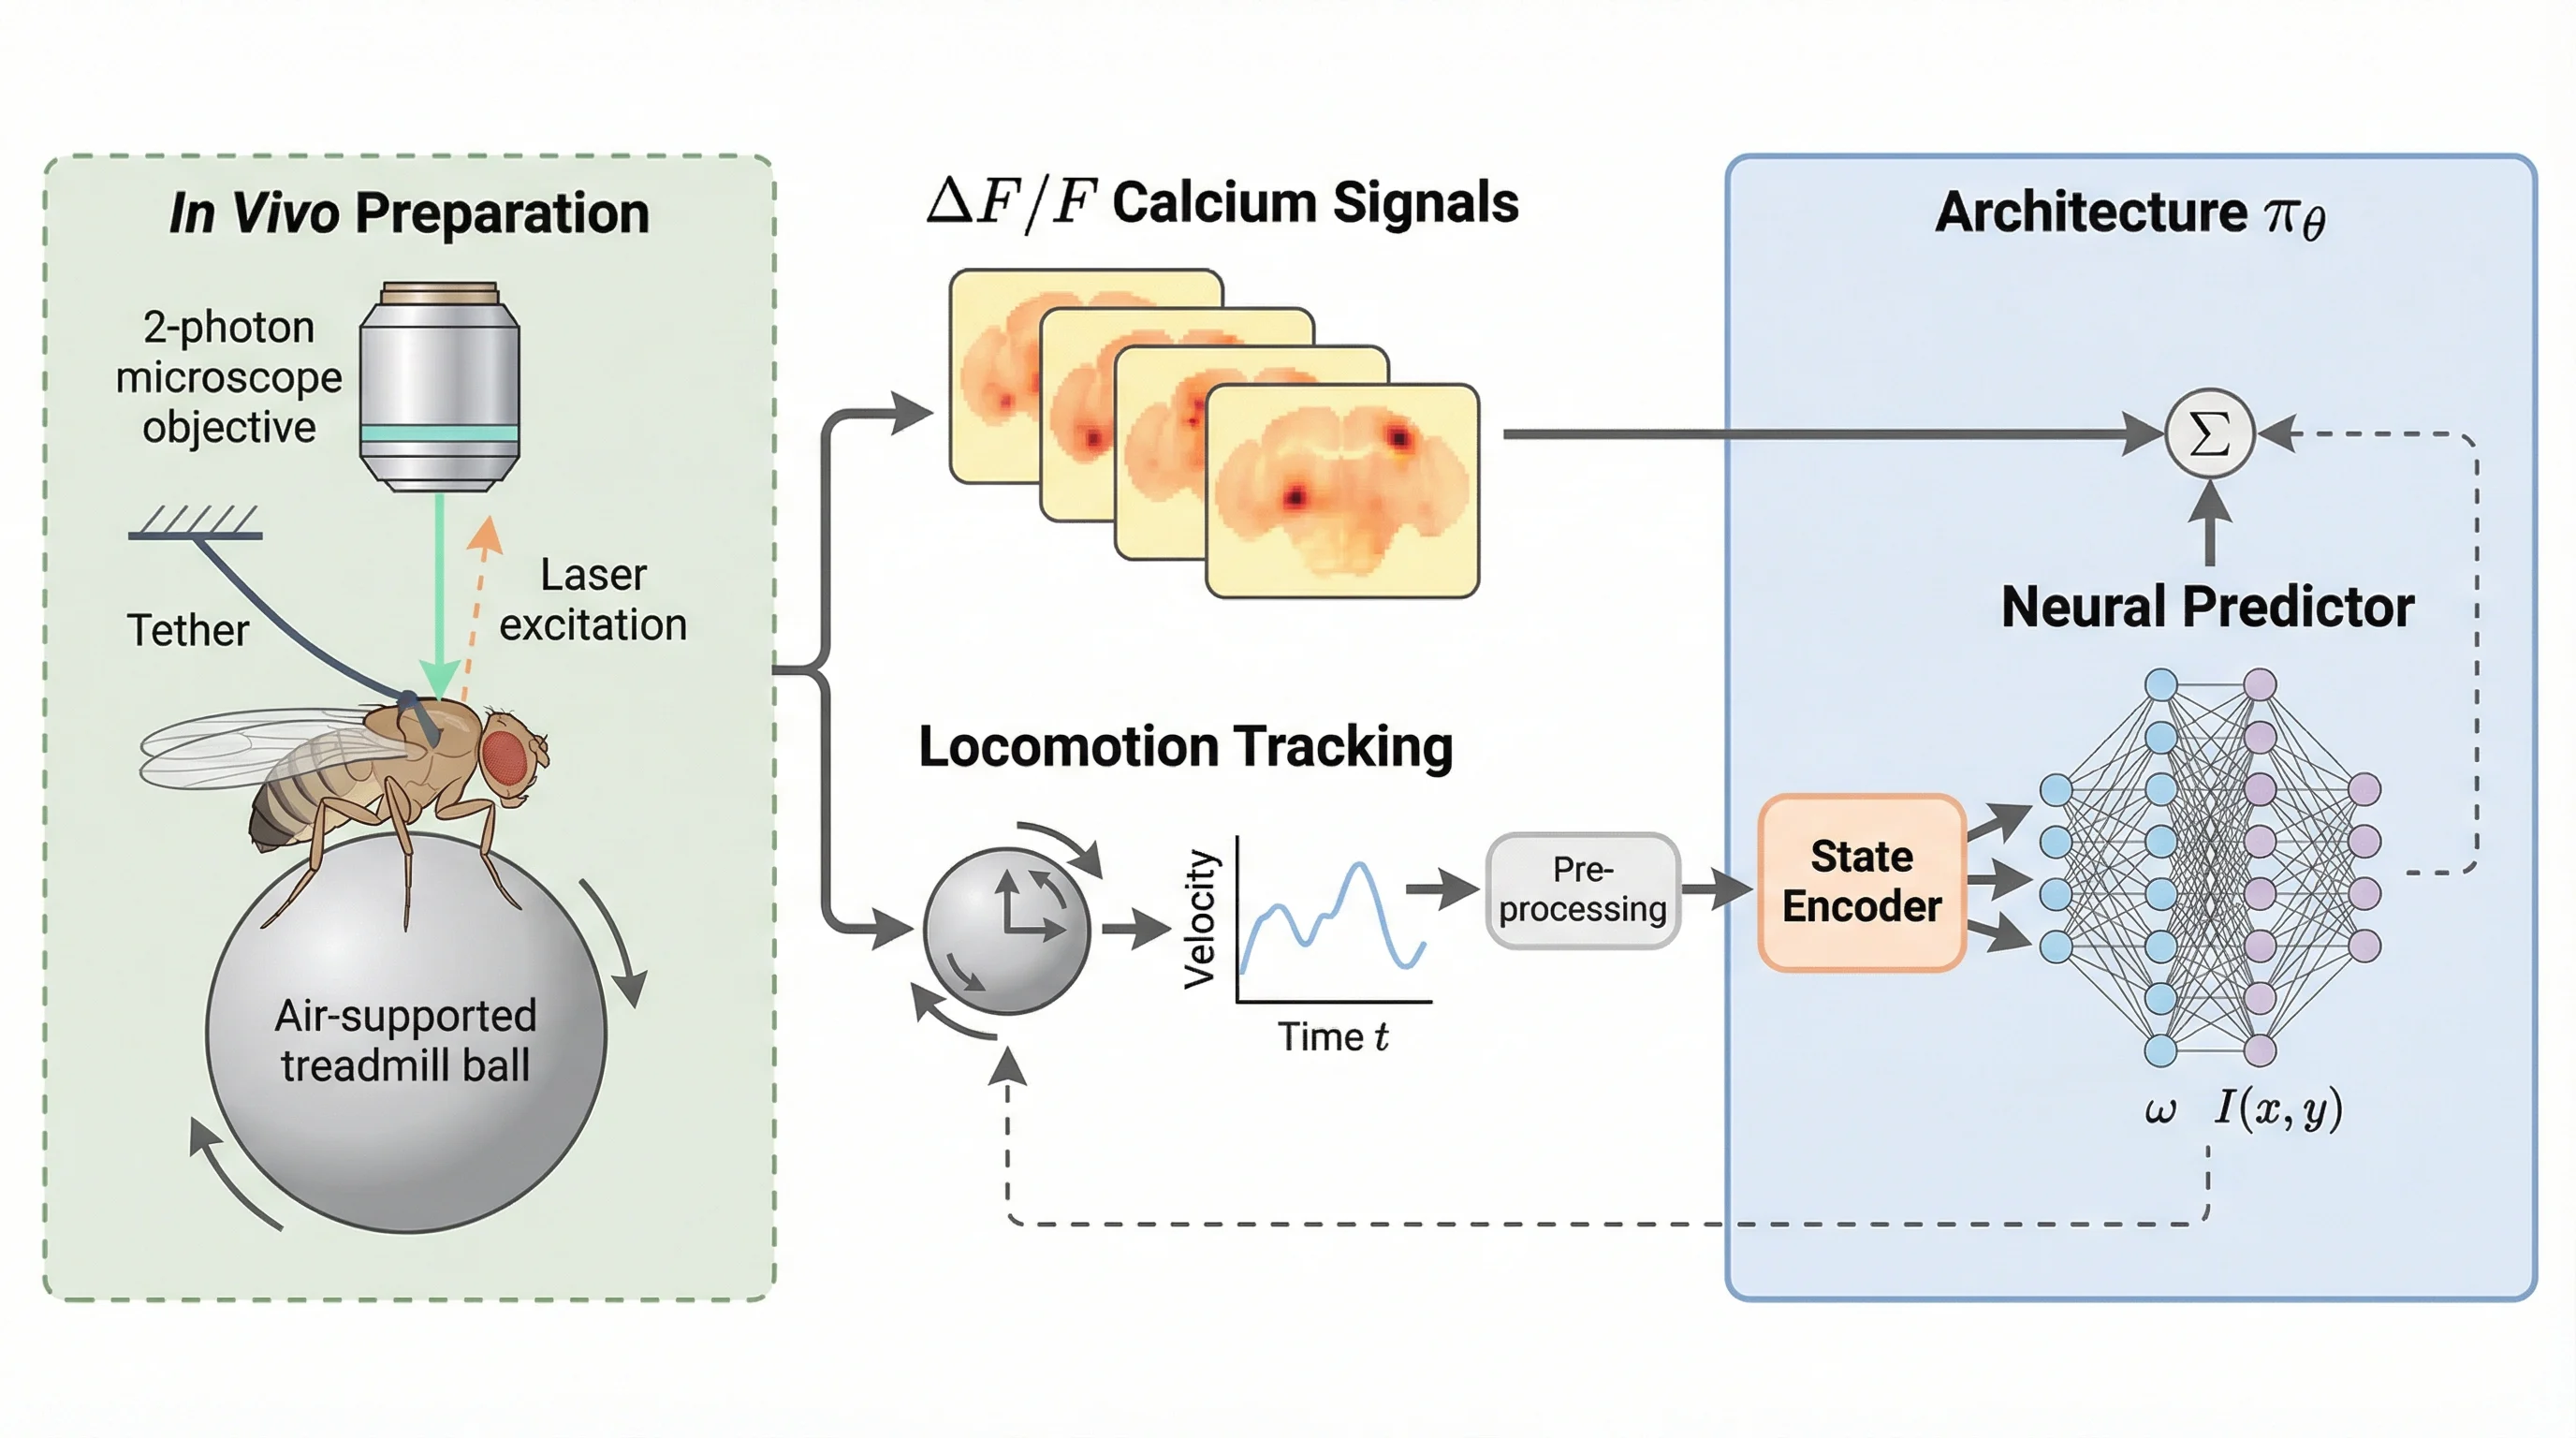
Network, Architecture, and Systems Diagrams
Create diagrams for AI systems, engineering processes, physics setups, clinical pathways, and interdisciplinary research networks.
Designed for Multi-Discipline Research
Scientific diagrams are used across biology, chemistry, medicine, computer science, physics, engineering, and interdisciplinary research.
Trusted by Scientists Worldwide
From PhD students to principal investigators, researchers use FigEditor to ship publication-ready figures faster.
I used to spend an entire afternoon redrawing pathway diagrams in Illustrator. FigEditor gives me a publication-ready figure in under a minute.
The architecture diagrams are clean enough that my advisor actually approved the first draft. That has literally never happened before.
We replaced our paid BioRender subscription for the lab. FigEditor handles 80% of our figures and the editing workflow is faster.
Graphical abstracts used to be the worst part of submission. Now I generate three options in 5 minutes and pick one.
Finally an AI tool that produces vector-quality scientific figures, not blurry slop. The SVG export is exactly what journals want.
English isn't my first language, but FigEditor understands my technical descriptions and renders the diagram correctly every time.
Scientific Diagram Maker FAQ
Answers for researchers choosing an online scientific diagram tool
Generate Your First AI Scientific Illustration
Stop juggling Illustrator, BioRender, and PowerPoint. The FigEditor AI scientific illustration suite turns prompts into journal-ready diagrams, papers and images into editable SVG vectors, and lets you refine every output in the in-browser editor — free to start. Posters and slides coming soon.
No credit card required · Free credits on signup