







01
Method diagrams
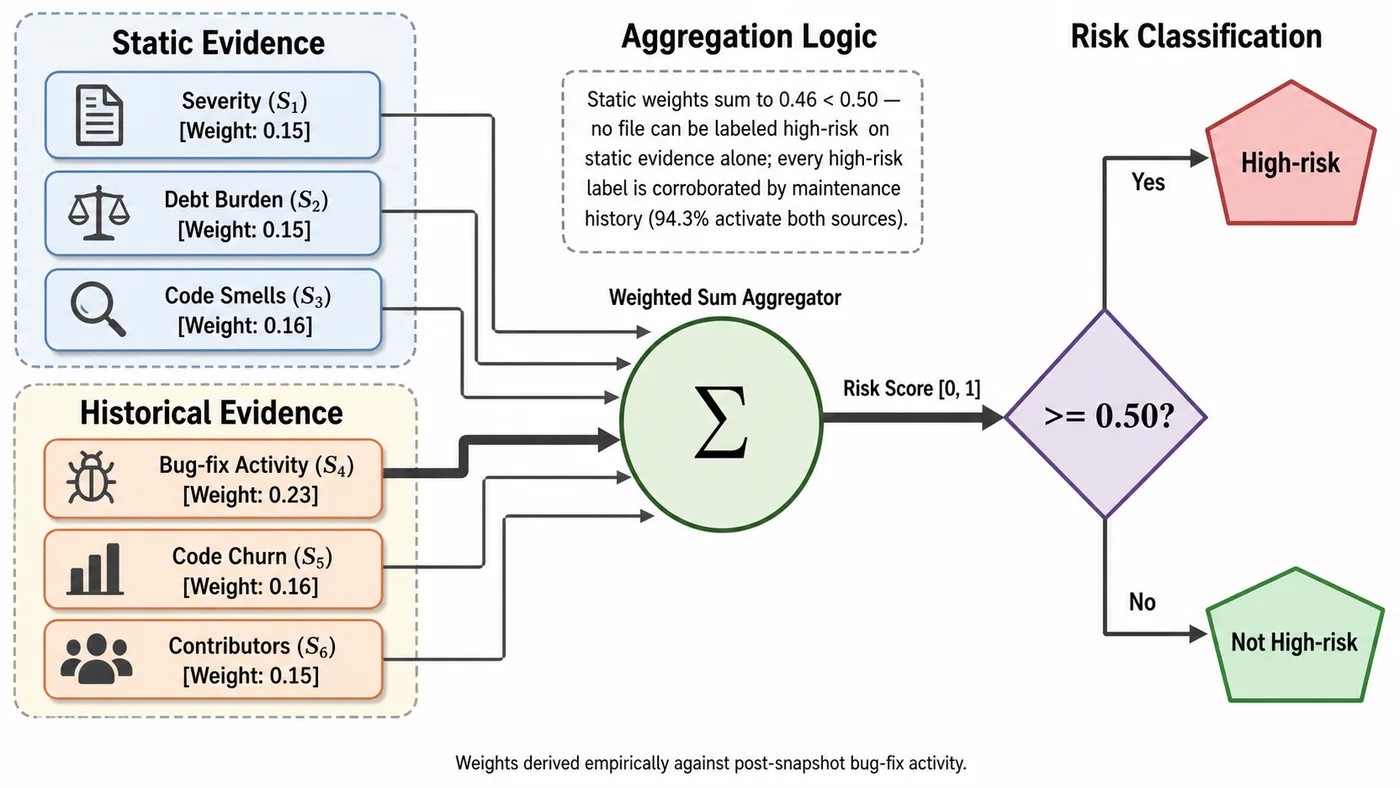
Convert dense method sections into a figure with explicit stages, inputs, outputs, and relationships.
Paper Banana turns raw paper text, data, or a rough sketch into a publication-ready academic illustration—planned, styled, rendered, and critiqued in one workflow.
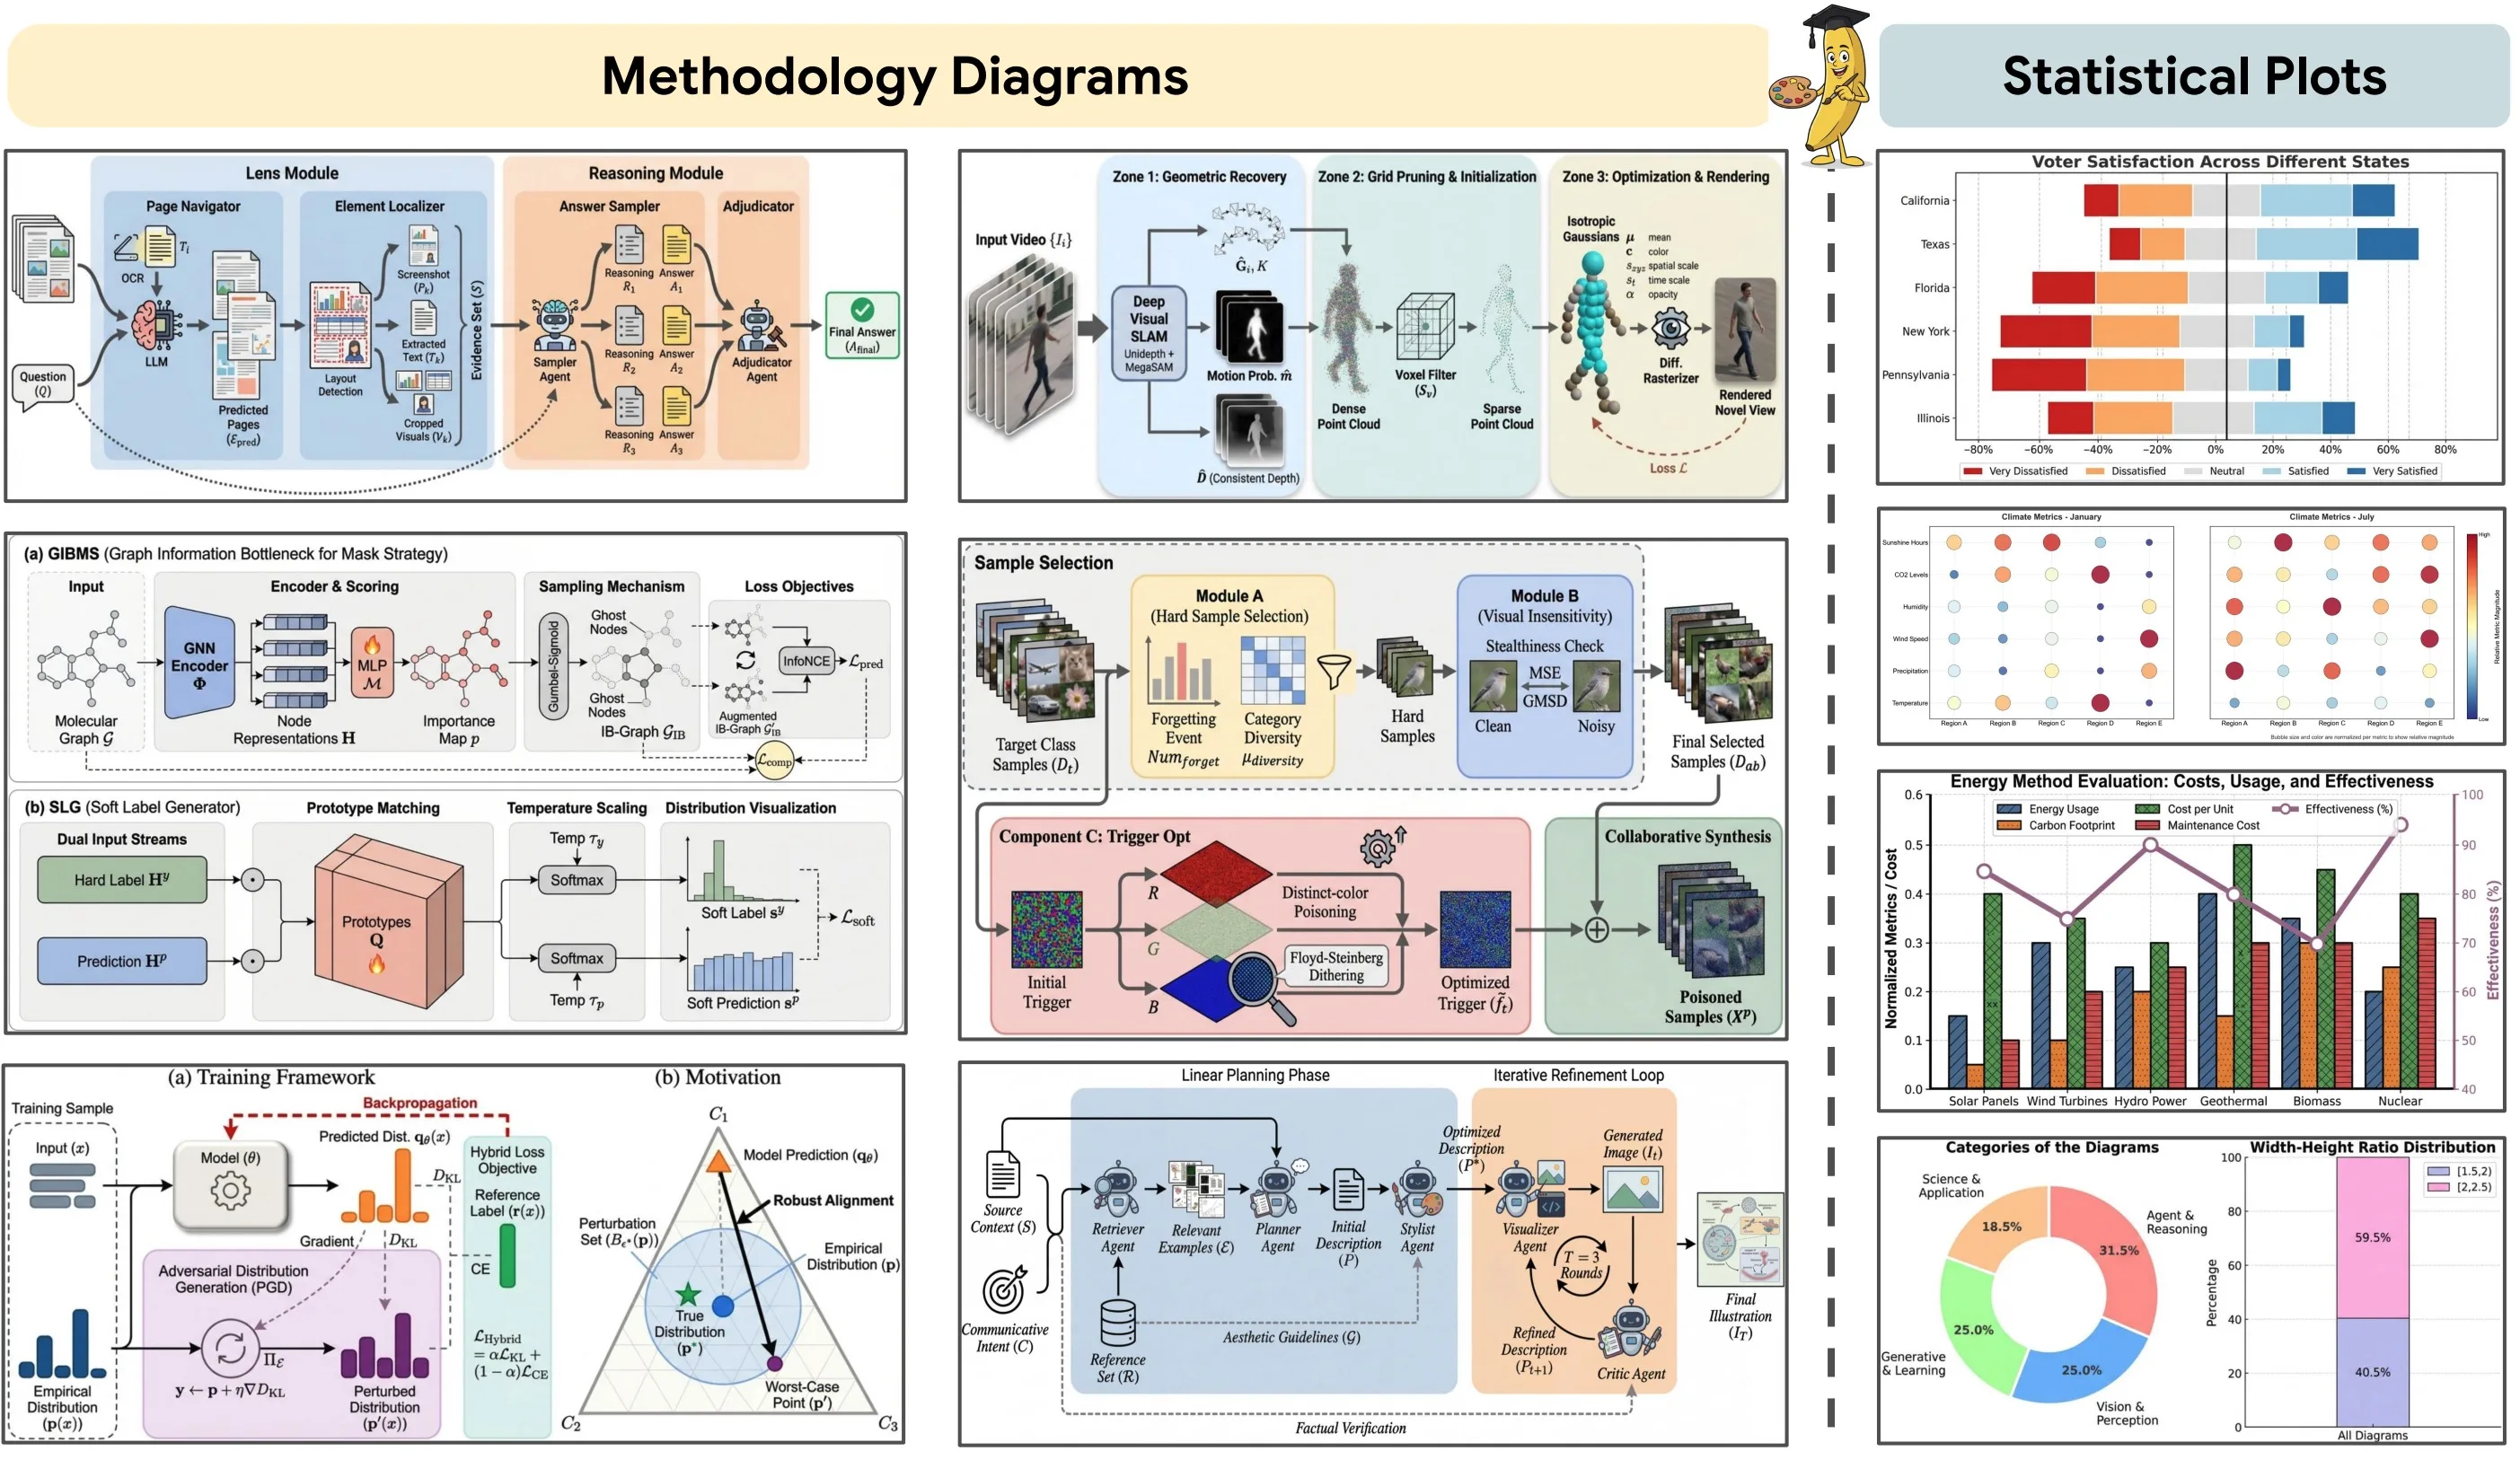
Turn research methodology into a clear, publication-ready scientific figure.
Use Basic for a quick start or Custom for precise visual control.
Start from a proven academic diagram pattern.
What it is
The original framework treats academic figure making as a sequence of research and design decisions. Each specialist has one job, and the critic closes the loop before the draft reaches you.
Convert dense method sections into a figure with explicit stages, inputs, outputs, and relationships.
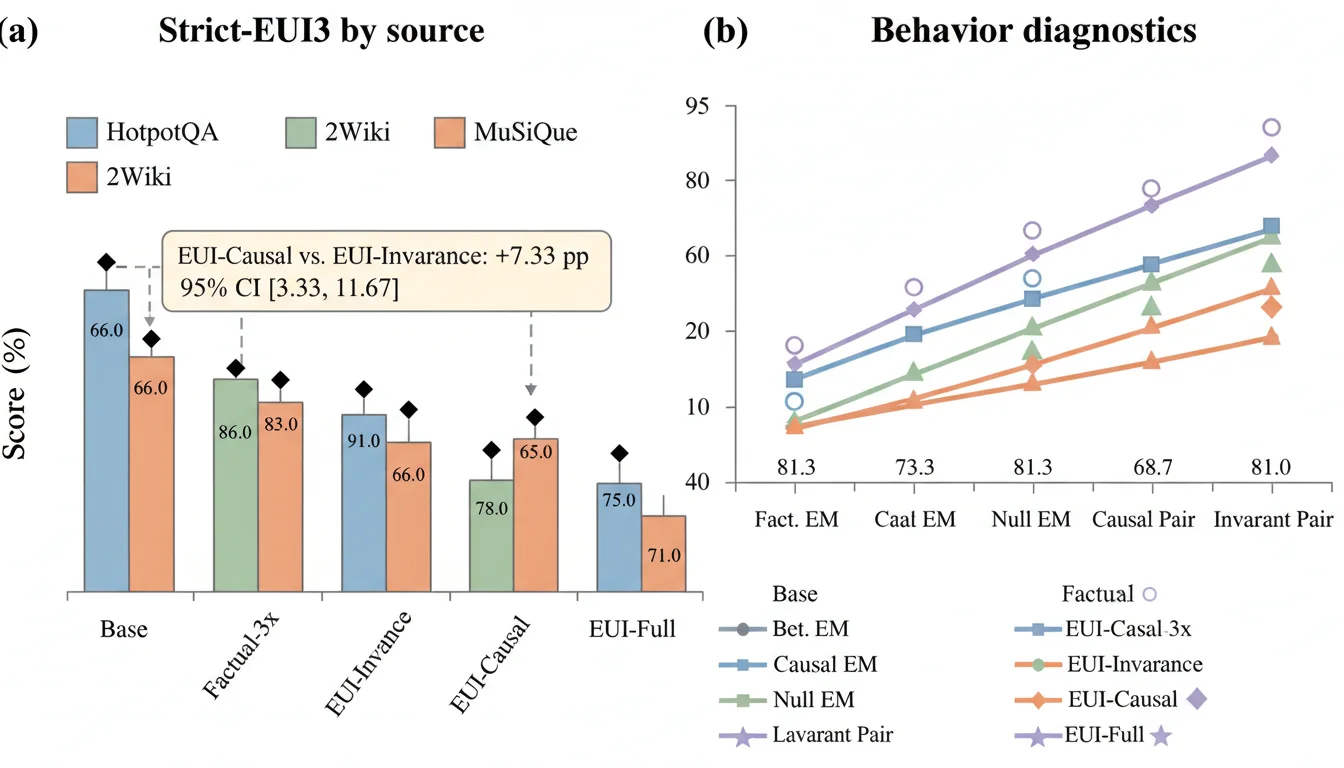
Turn supplied values into presentation-ready plots while explicitly protecting numerical fidelity.
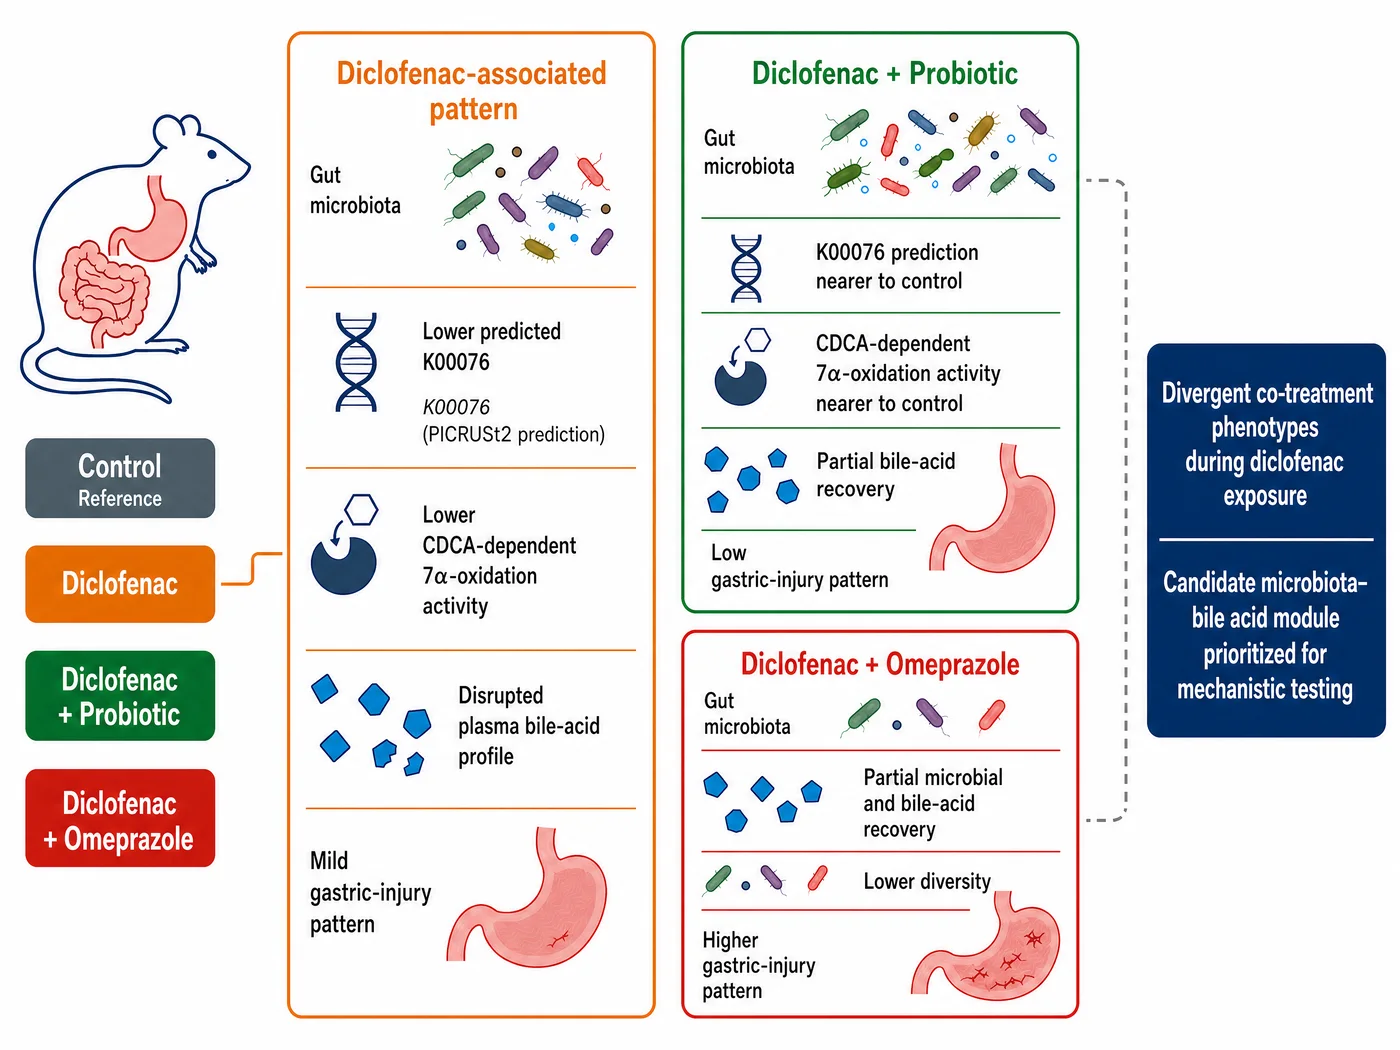
Upload a rough sketch or existing figure and refine its hierarchy, palette, spacing, and typography.
Why researchers use it
New project-specific illustrations generated for this page—computer vision, computational biology, and robotics.
Workflow
Follow the same path as the generator: choose a task, add your source material, configure the output, and review the result.
Create with Paper BananaSelect Generate a figure or Polish a figure, then paste your research content. Polishing also requires a reference image.
Choose an image model. Keep a Basic preset or switch to Custom for figure type, visual style, venue, aspect ratio, resolution, and a reference image.
Confirm the displayed credit cost, sign in if needed, and start the task. Check the preview for labels, arrows, values, and claims, then open or download the finished image.
Inside the workflow
These examples show what happens after you start a generation. Each agent owns one responsibility, from finding visual references to the final critique.
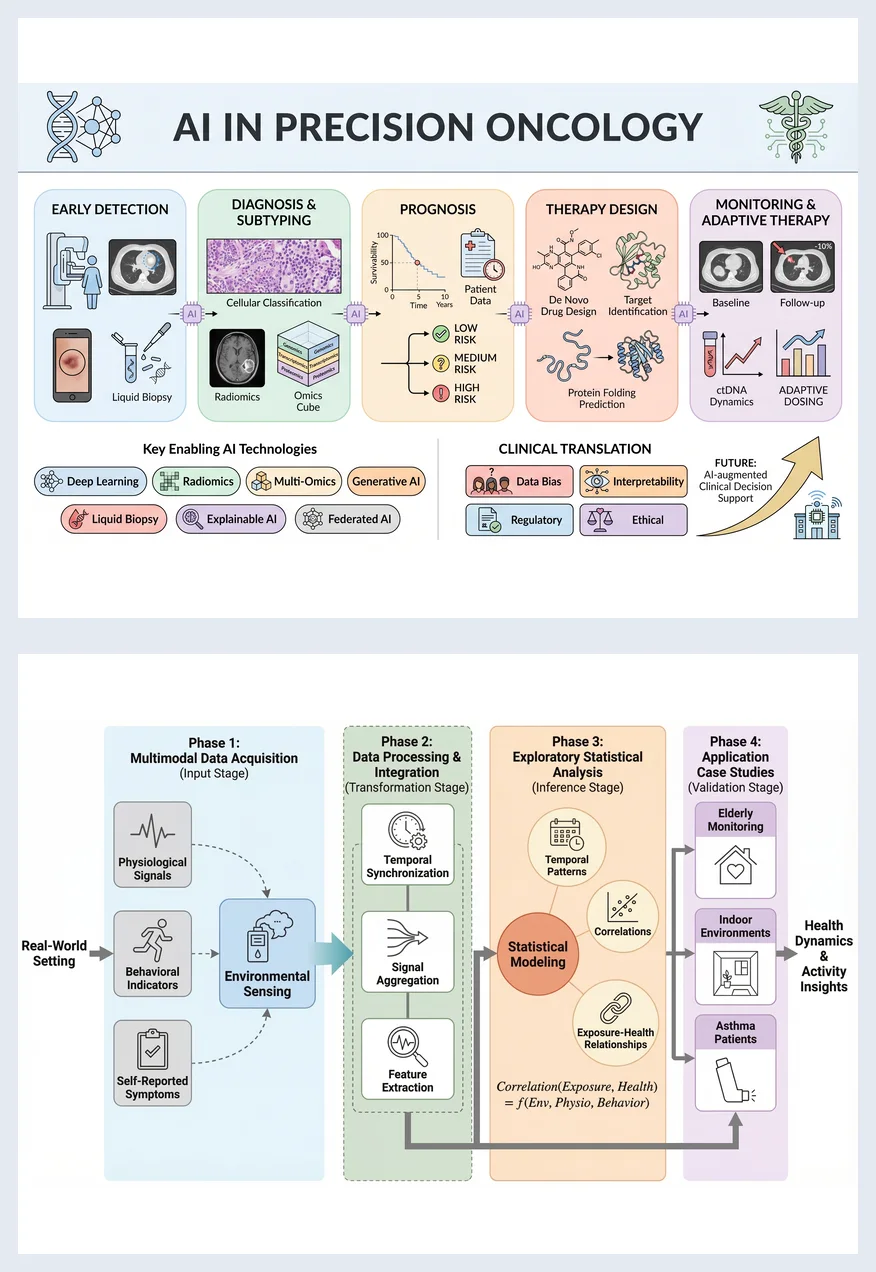
Finds visual references that match the research domain.
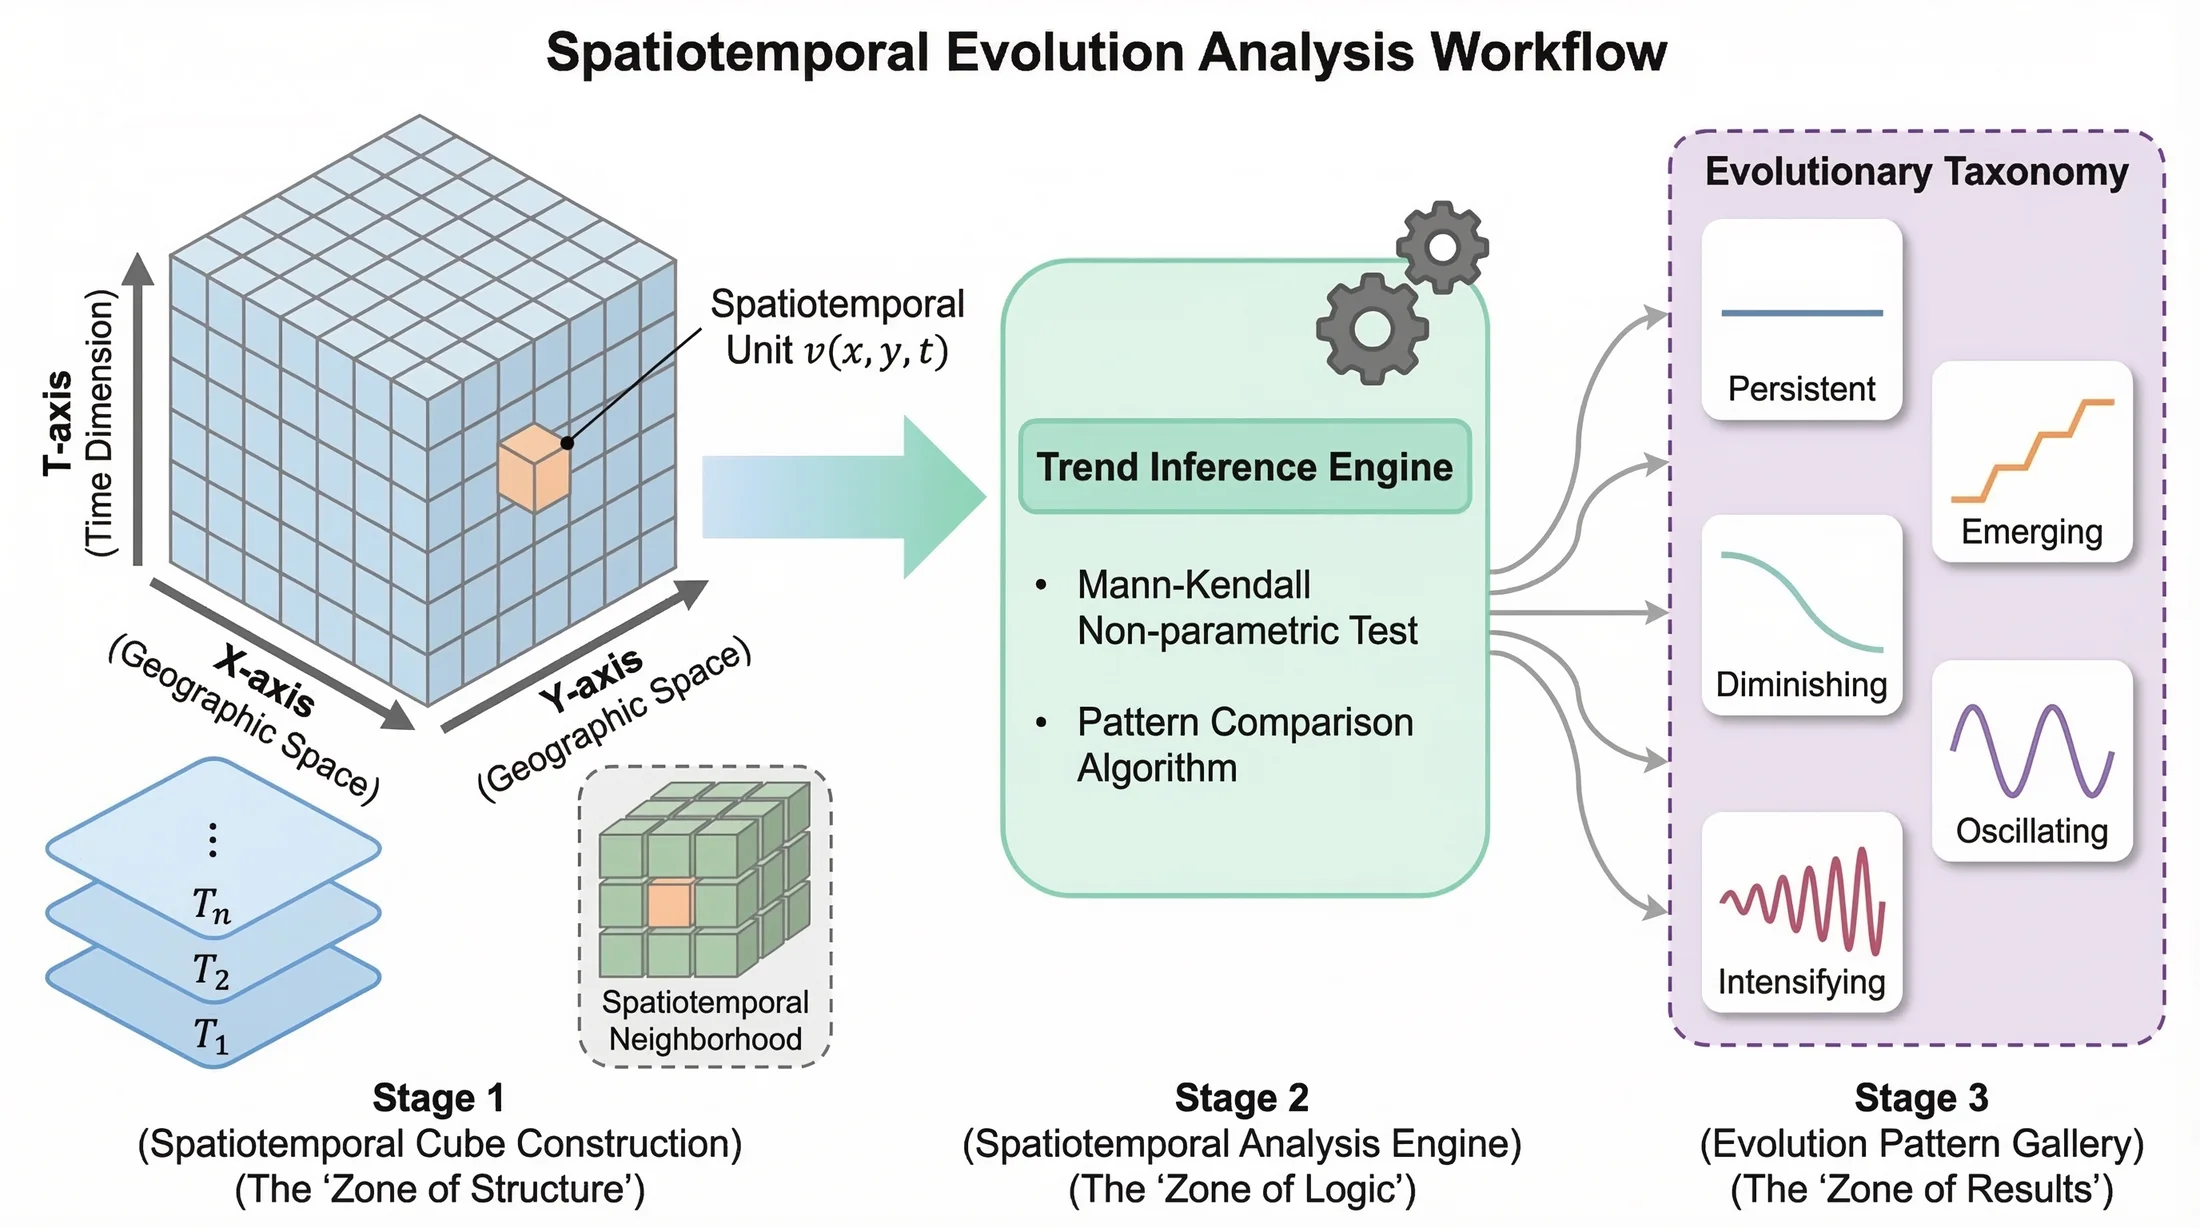
Turns scientific context into a concise visual hierarchy.
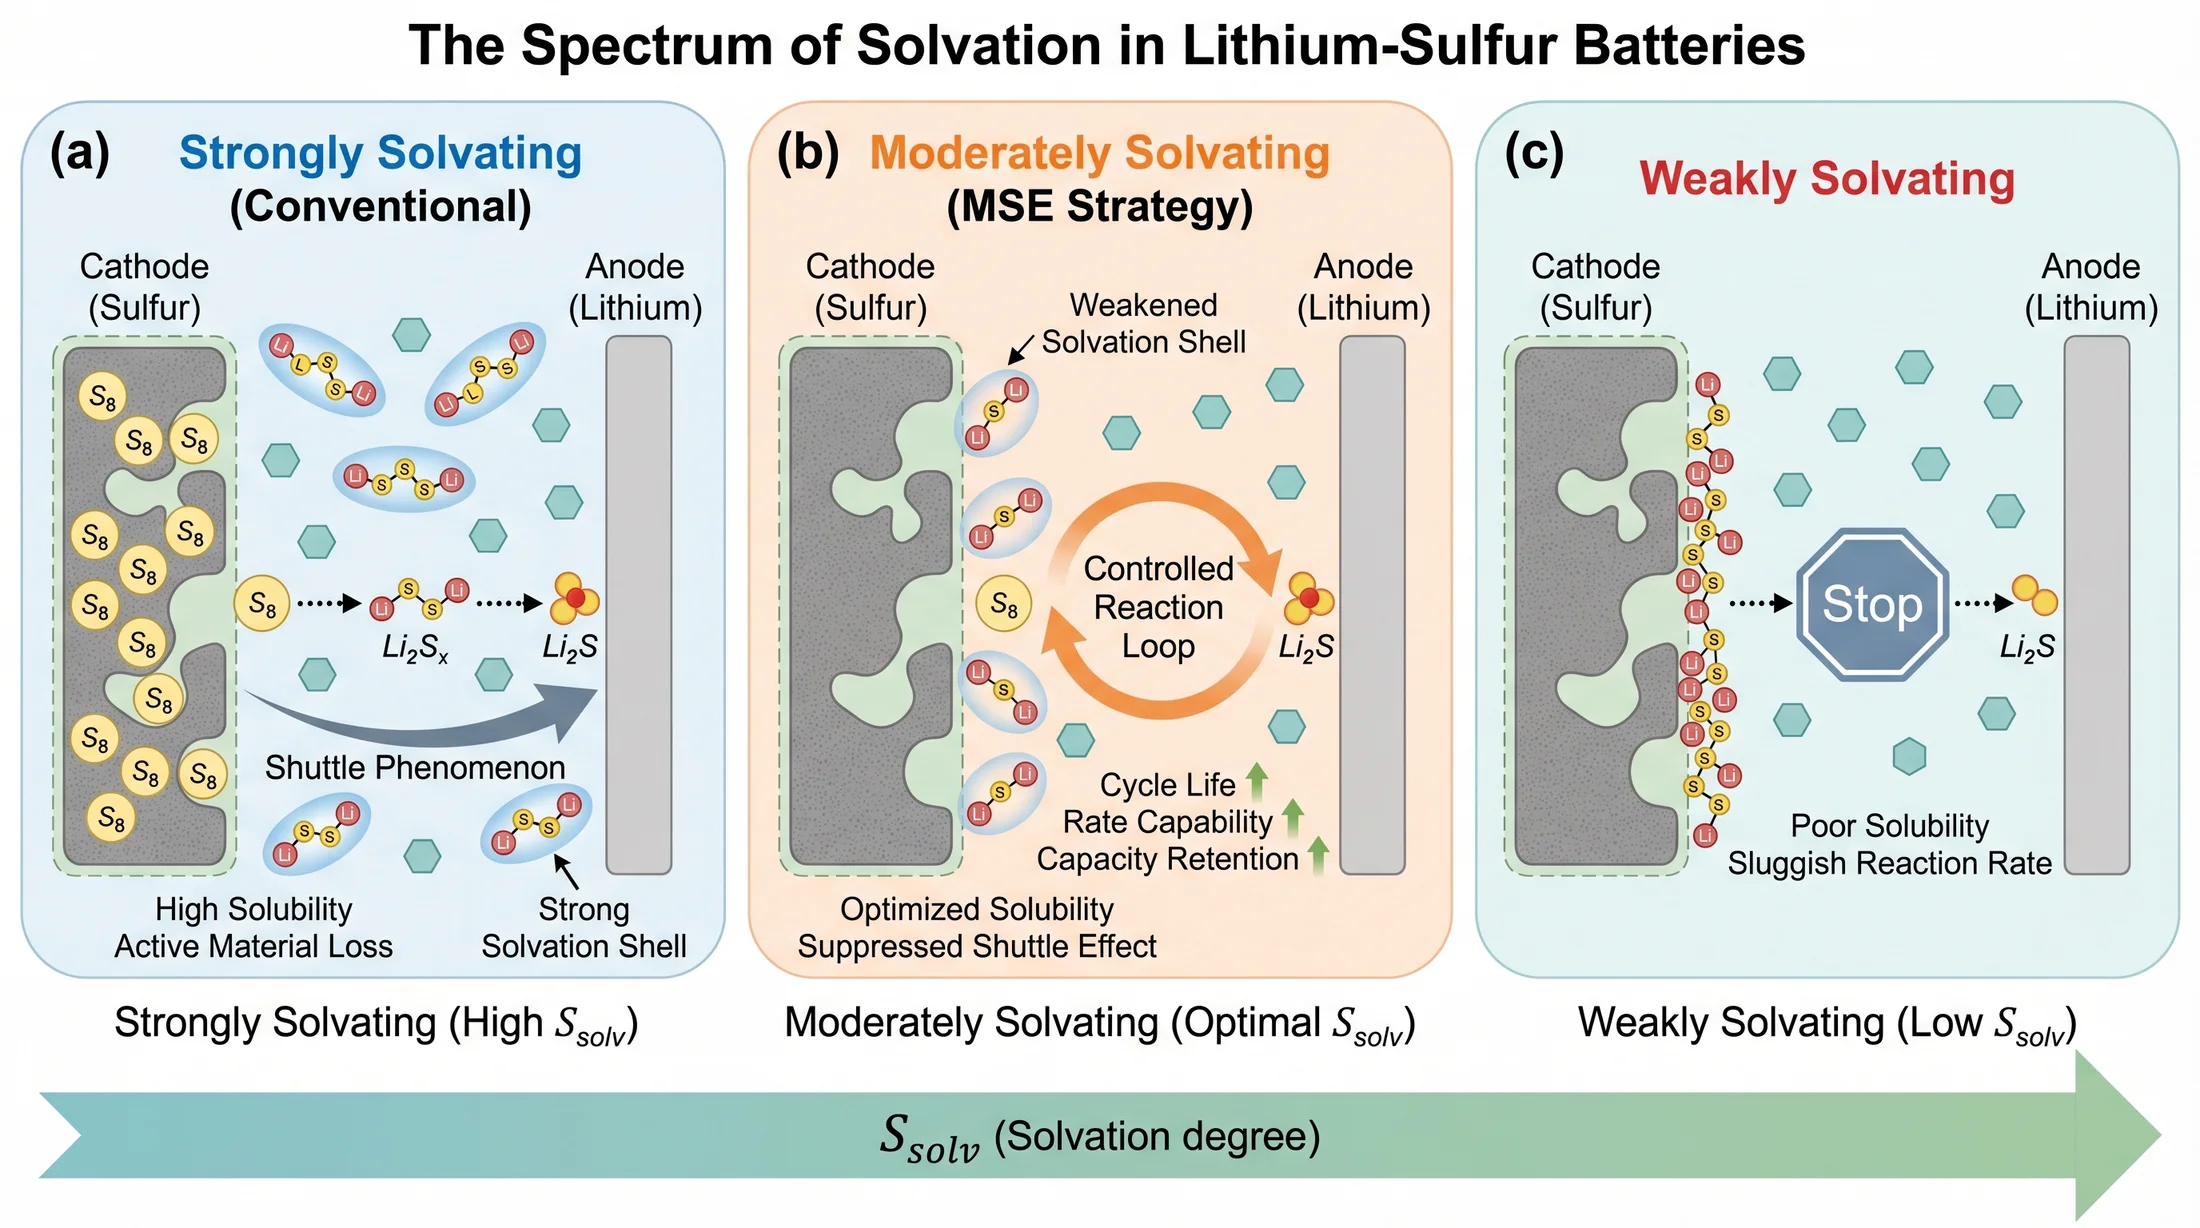
Adapts color, typography, and density to academic norms.
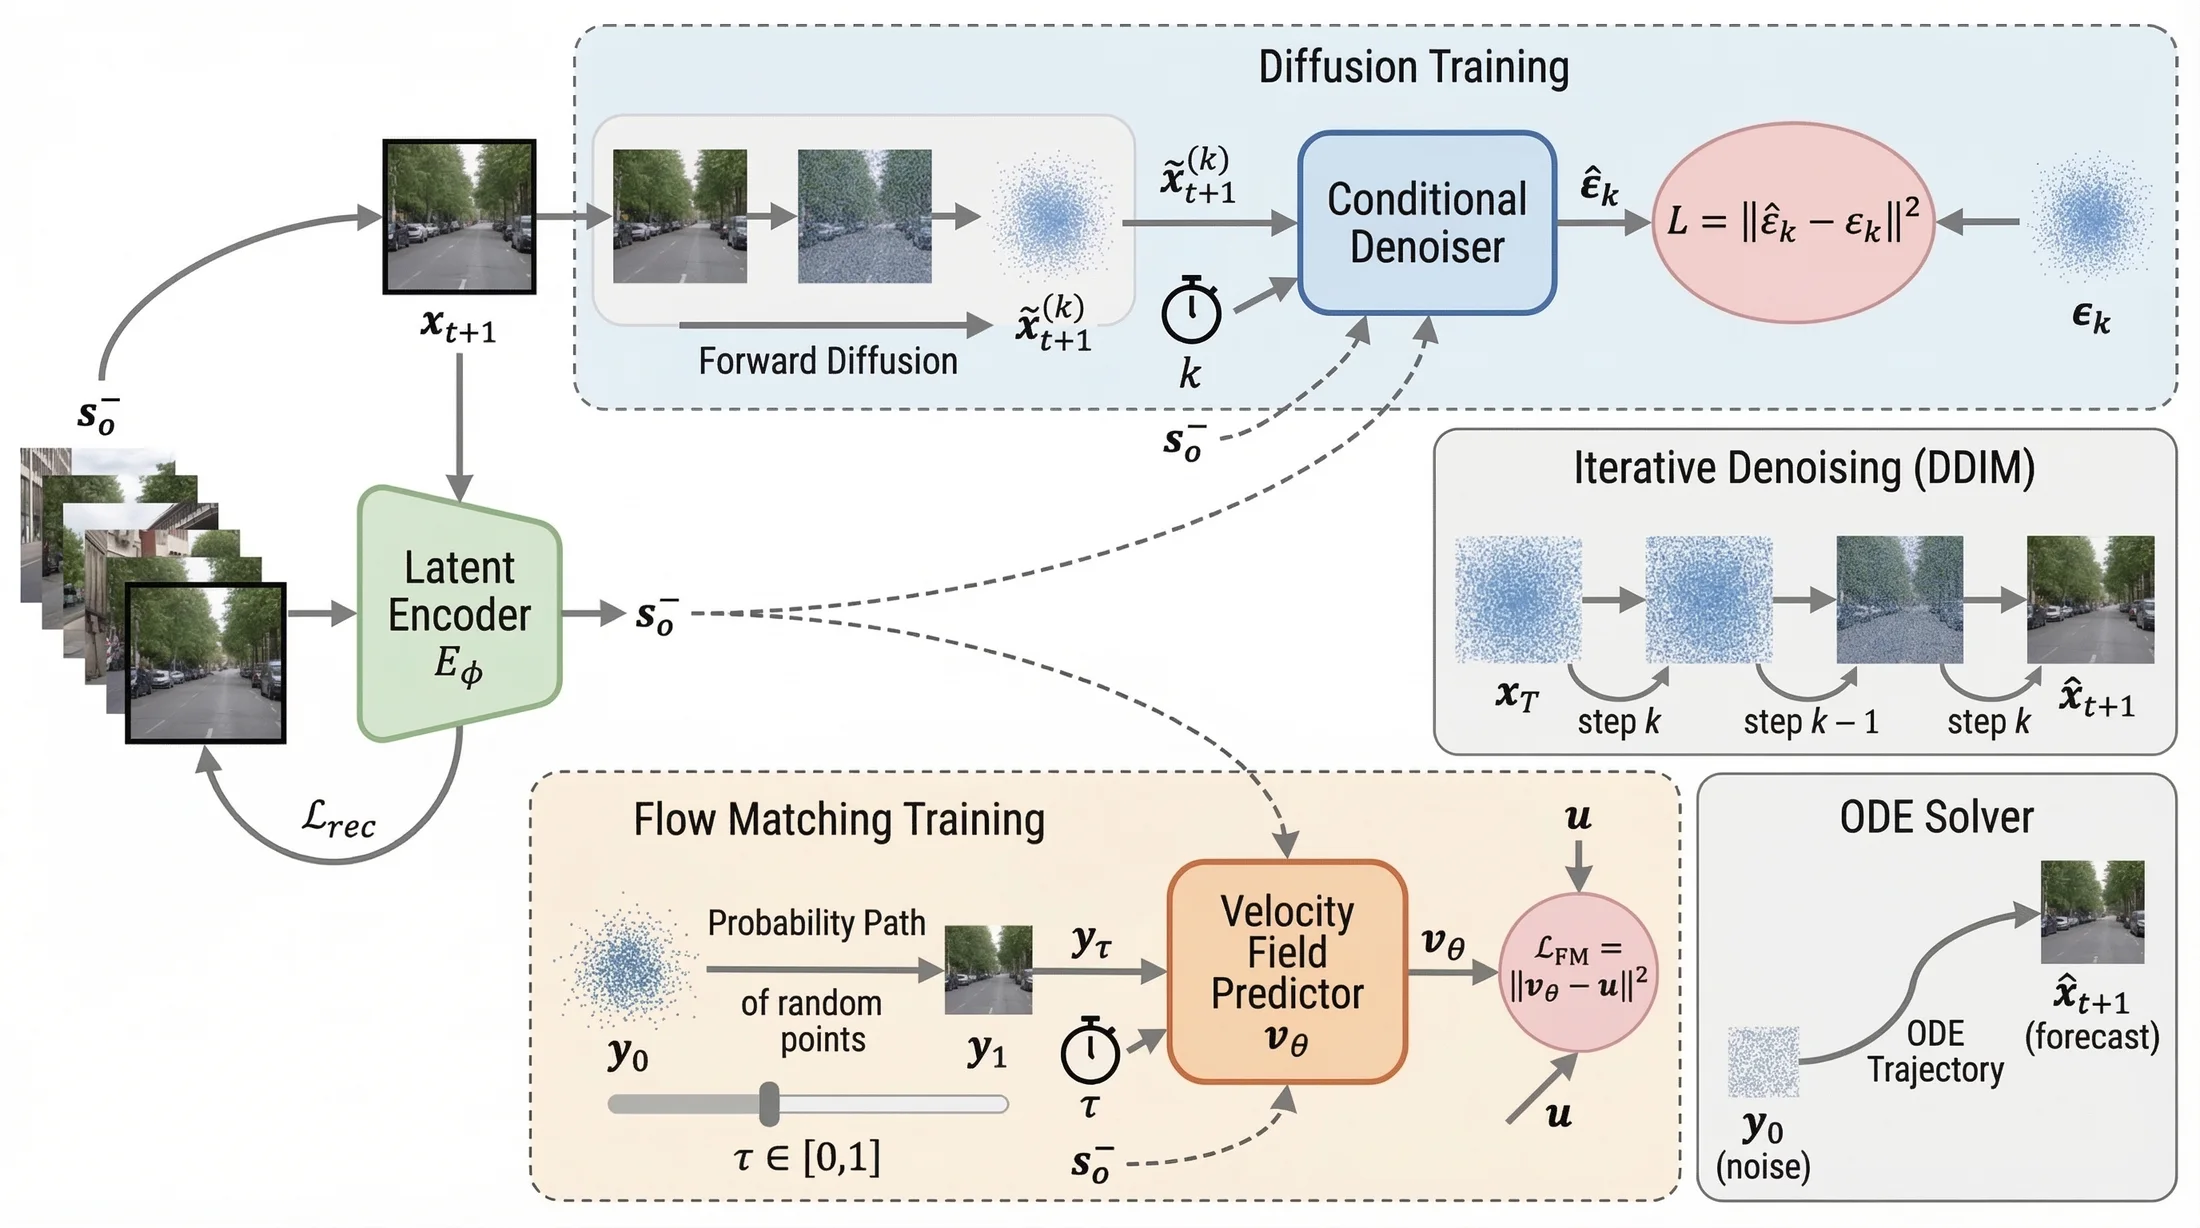
Renders the planned diagram or statistical figure.
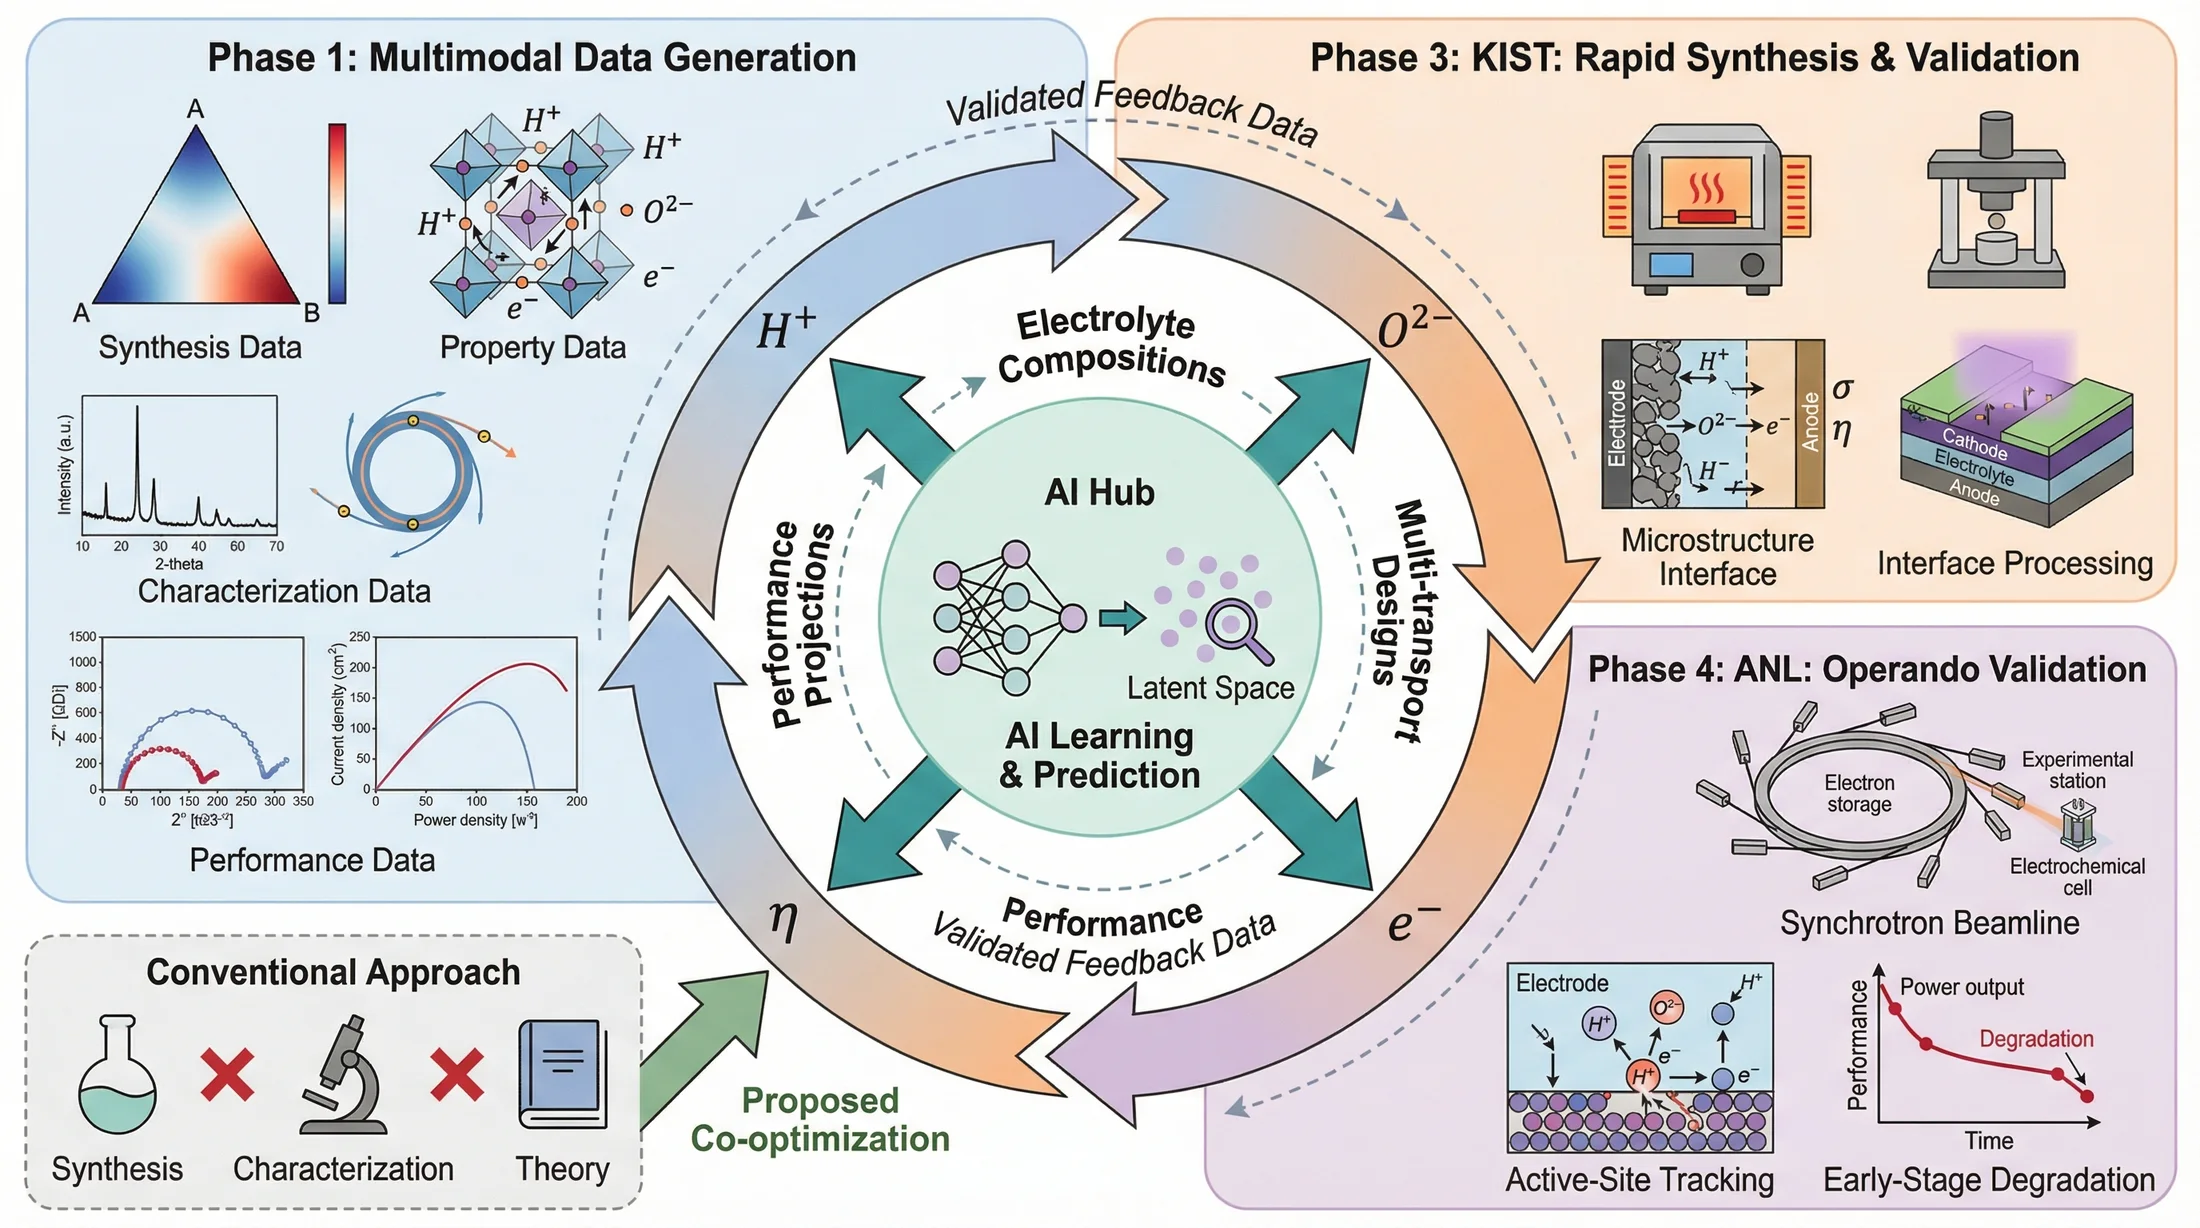
Reviews faithfulness, readability, and visual economy.
Use cases
Convert dense method sections into a figure with explicit stages, inputs, outputs, and relationships.
Create with Paper Banana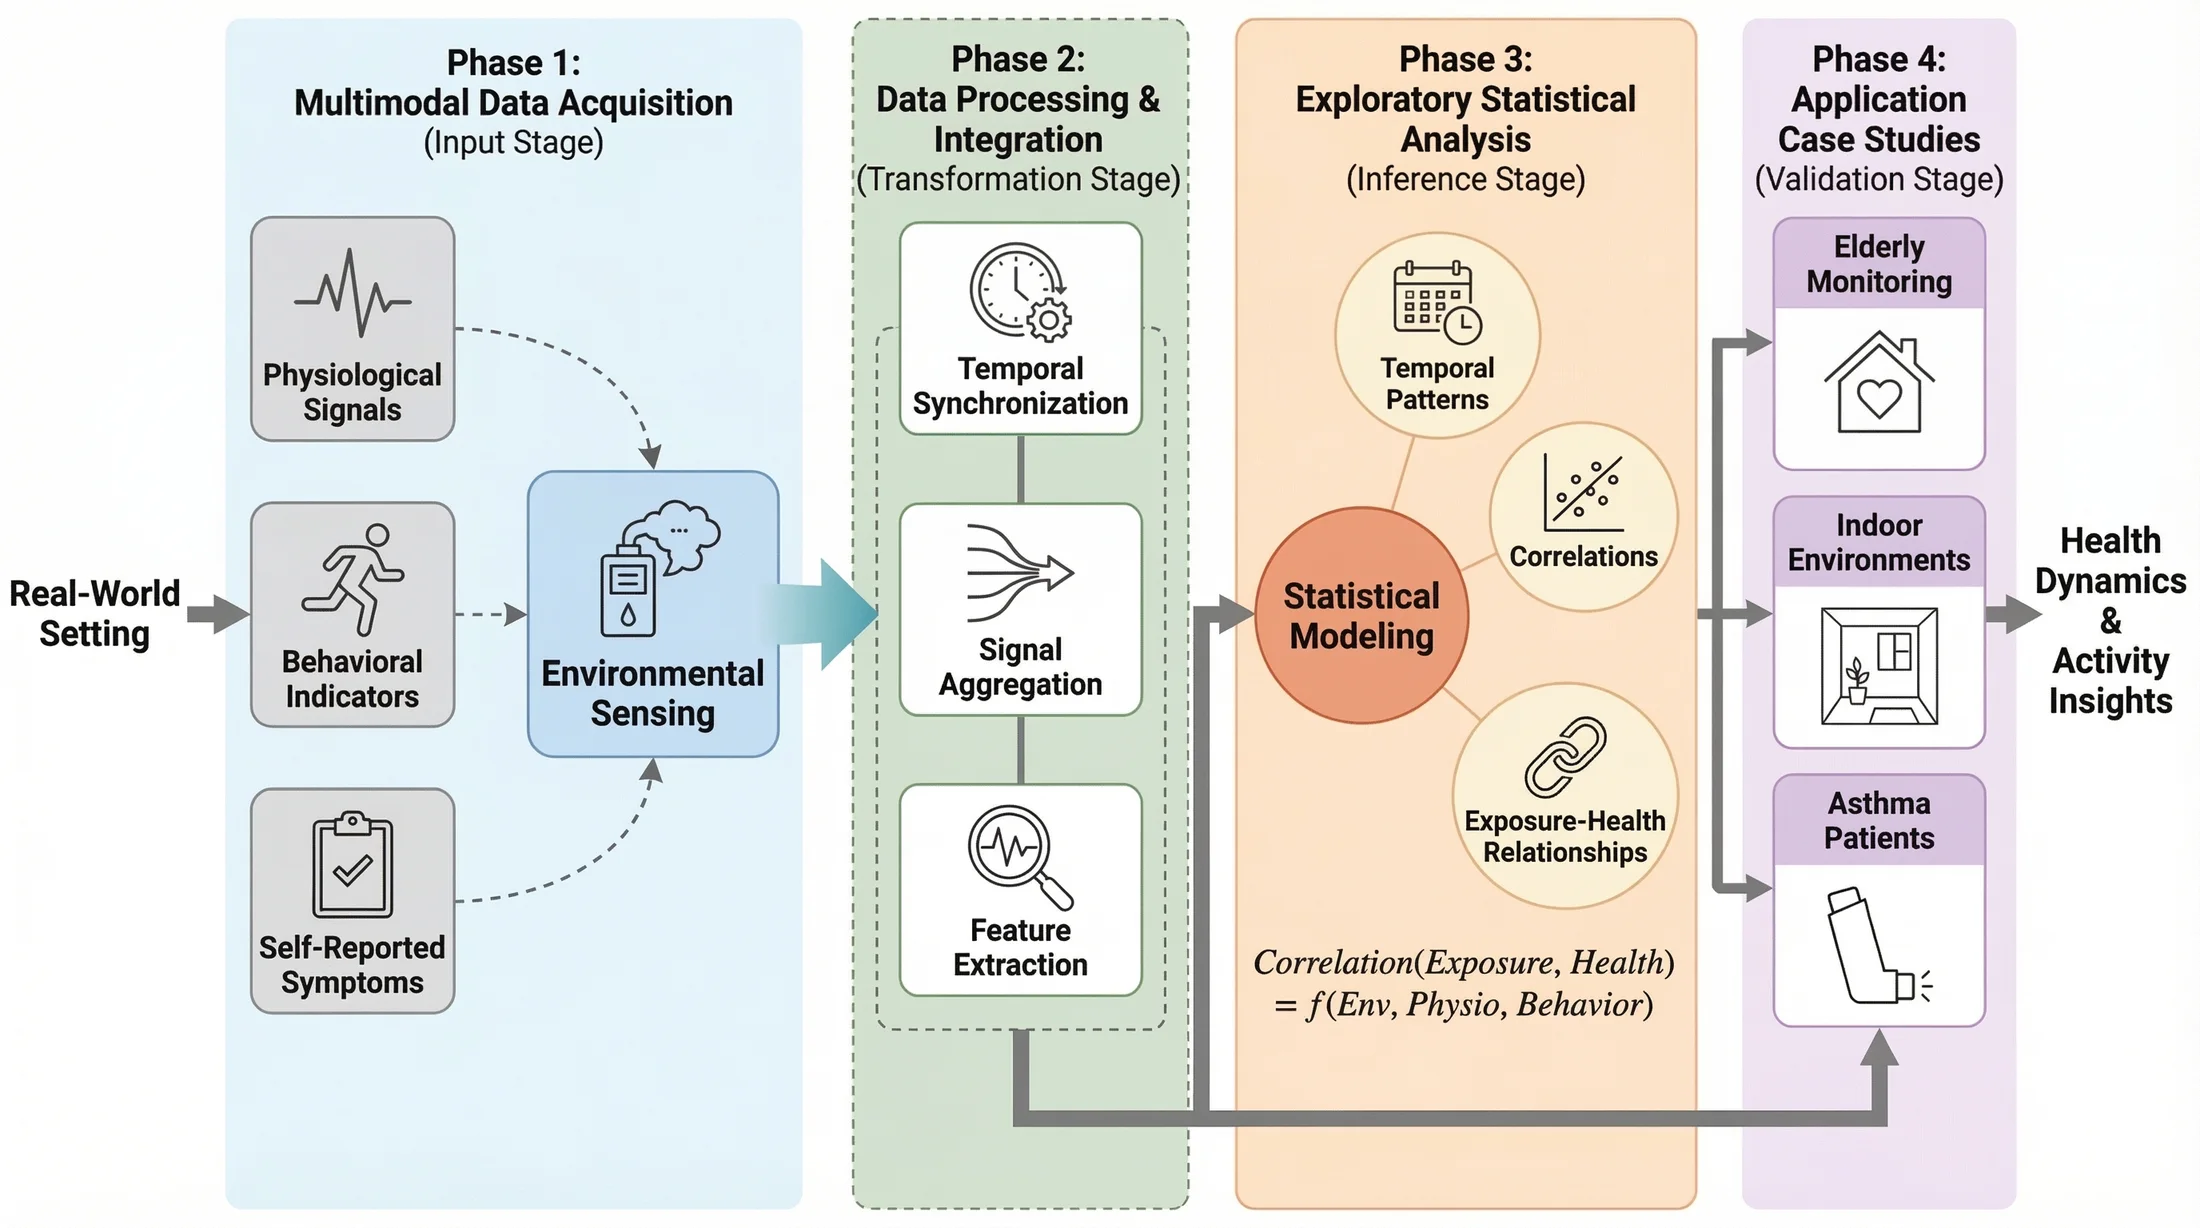
PaperBananaBench
The original project curated methodology diagrams from NeurIPS 2025 and assessed generated results across four publication-relevant dimensions.
Read the evaluation paperStart with free credits, subscribe for regular figure creation, or purchase a credit pack for your next paper or presentation.
FAQ
Everything you need to know about AI academic illustration generation
Cancel anytime · Subscription credits are valid for 30 days
For individual researchers who need the complete visual workflow with a practical credit allowance
For teams that need high-volume credits, commercial use, and support across the full workflow