Create scientific figures, precise illustrations, and conference posters in focused workspaces built for each stage of publishing.
A growing collection for researchers, authors, and scientific communicators.
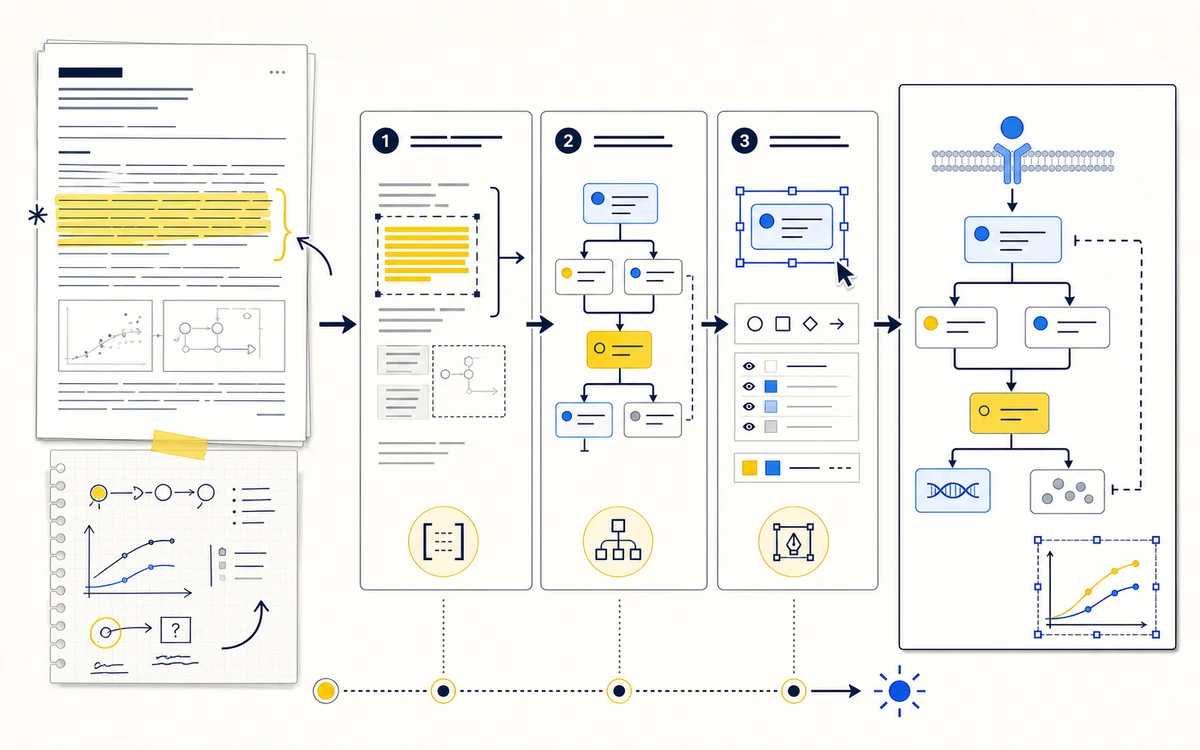
Turn paper text, notes, or a rough idea into an editable, publication-ready scientific figure.
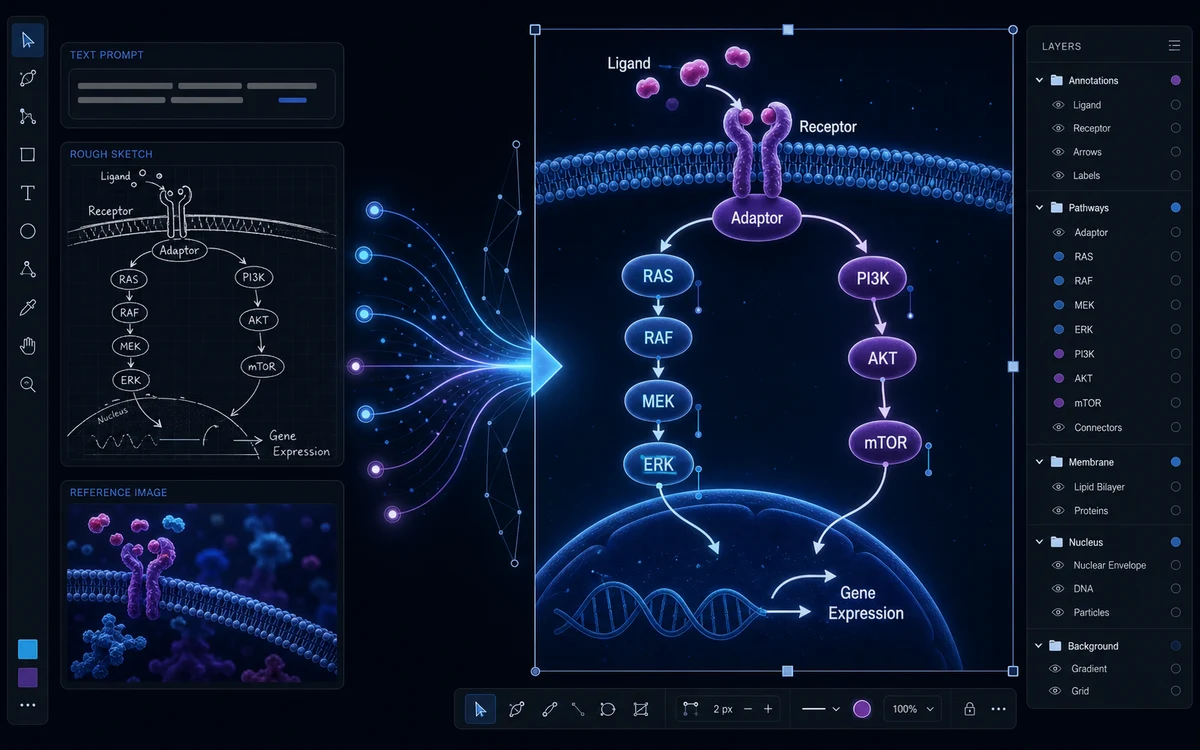
Generate precise scientific illustrations from a prompt, sketch, or reference—then refine them in one workspace.
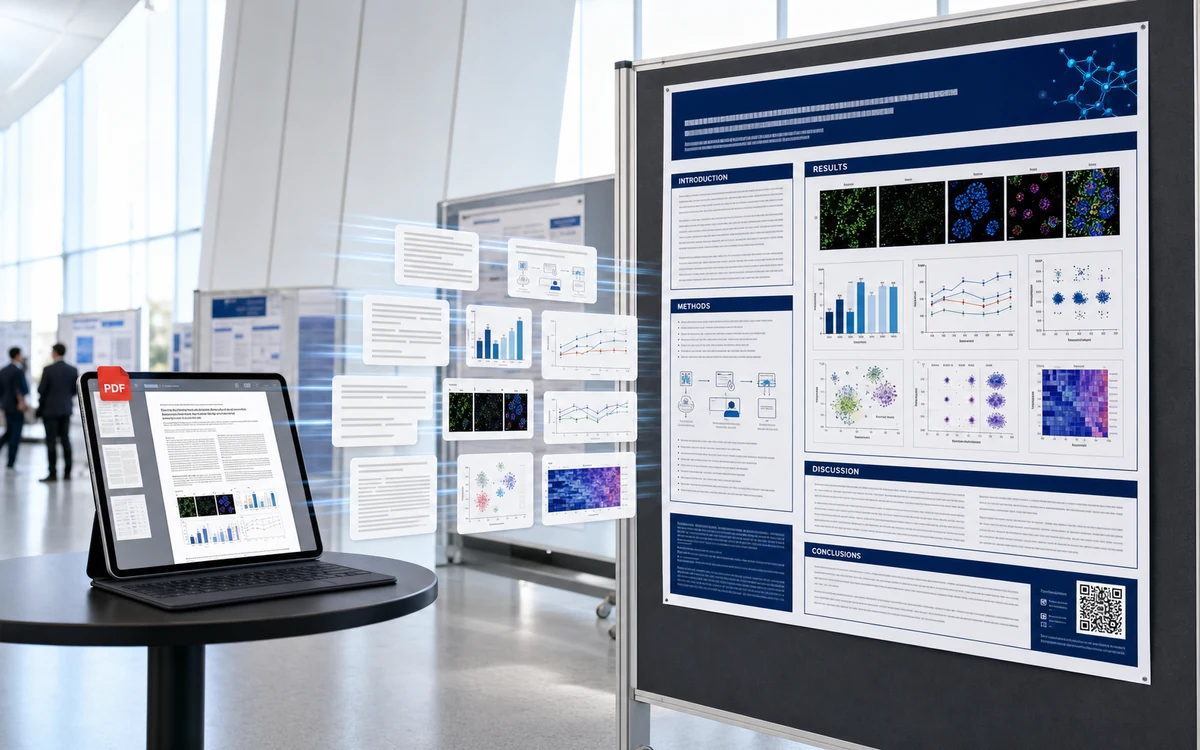
Upload a paper and turn its structure, data, and figures into a conference-ready research poster.
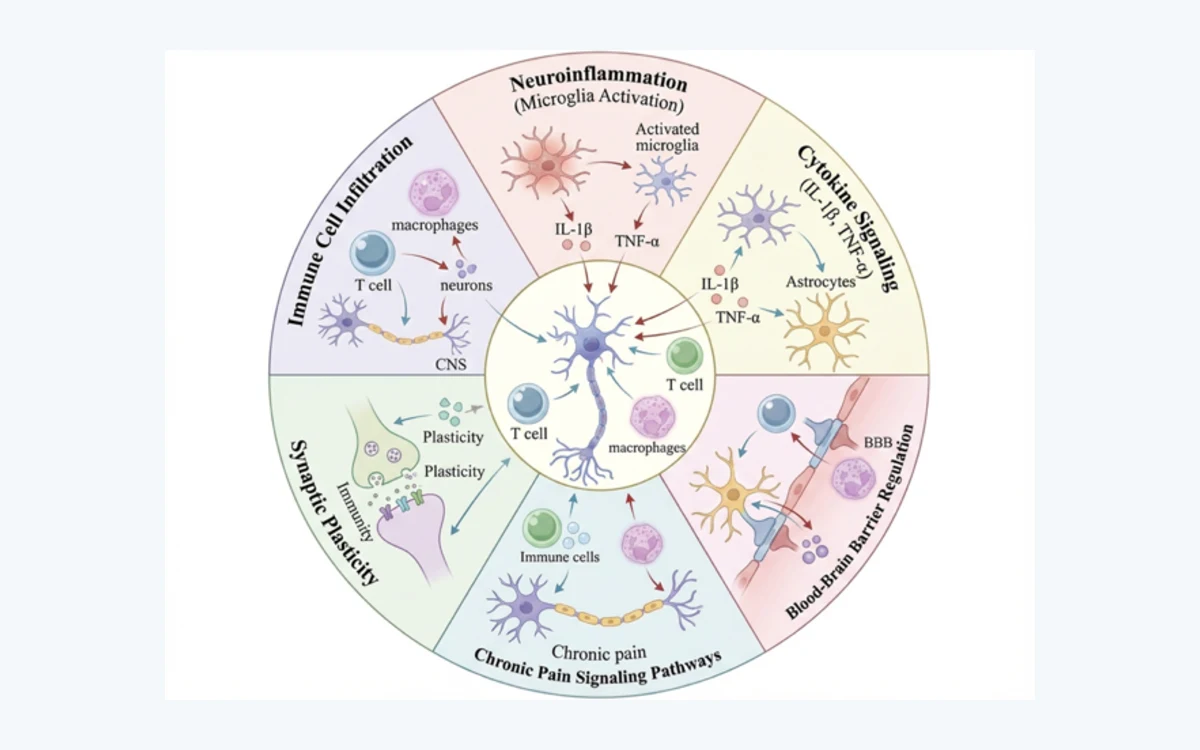
Turn a research summary into a clear graphical abstract, then refine the labels, arrows, and layout in FigEditor.

Turn research variables, theories, and hypotheses into a clear conceptual framework for a thesis or paper.
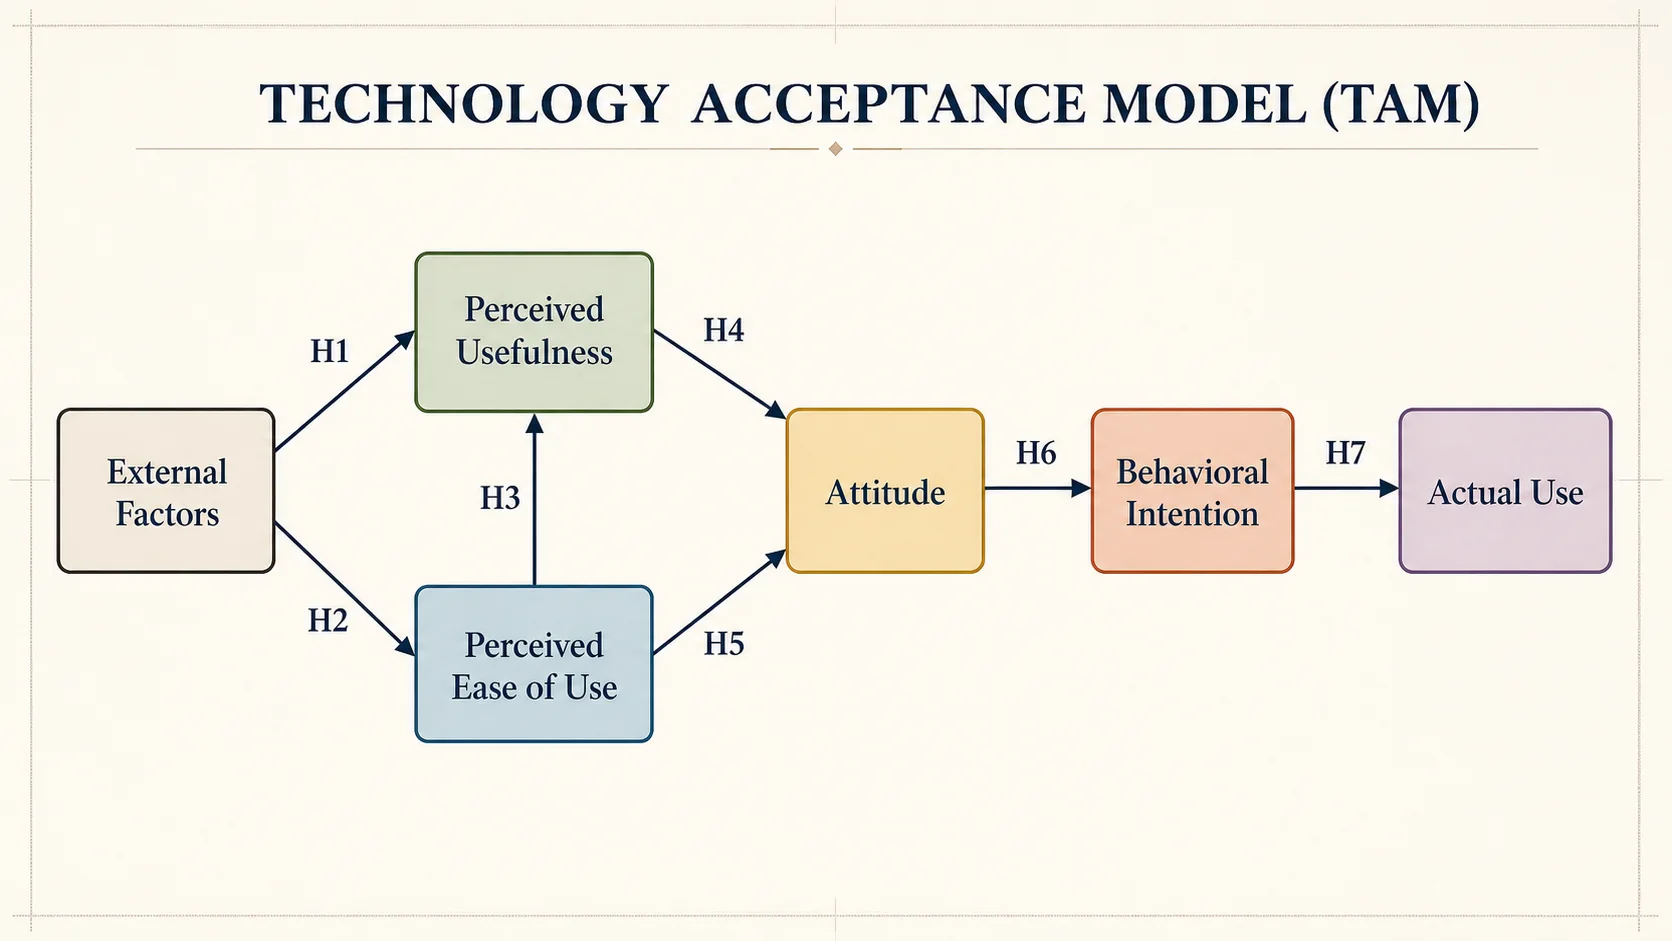
Turn a named theory, its core constructs, and propositions into an editable framework for a thesis or paper.

Create custom journal and notebook cover art from a prompt or your own image, then refine the title and layout in FigEditor.
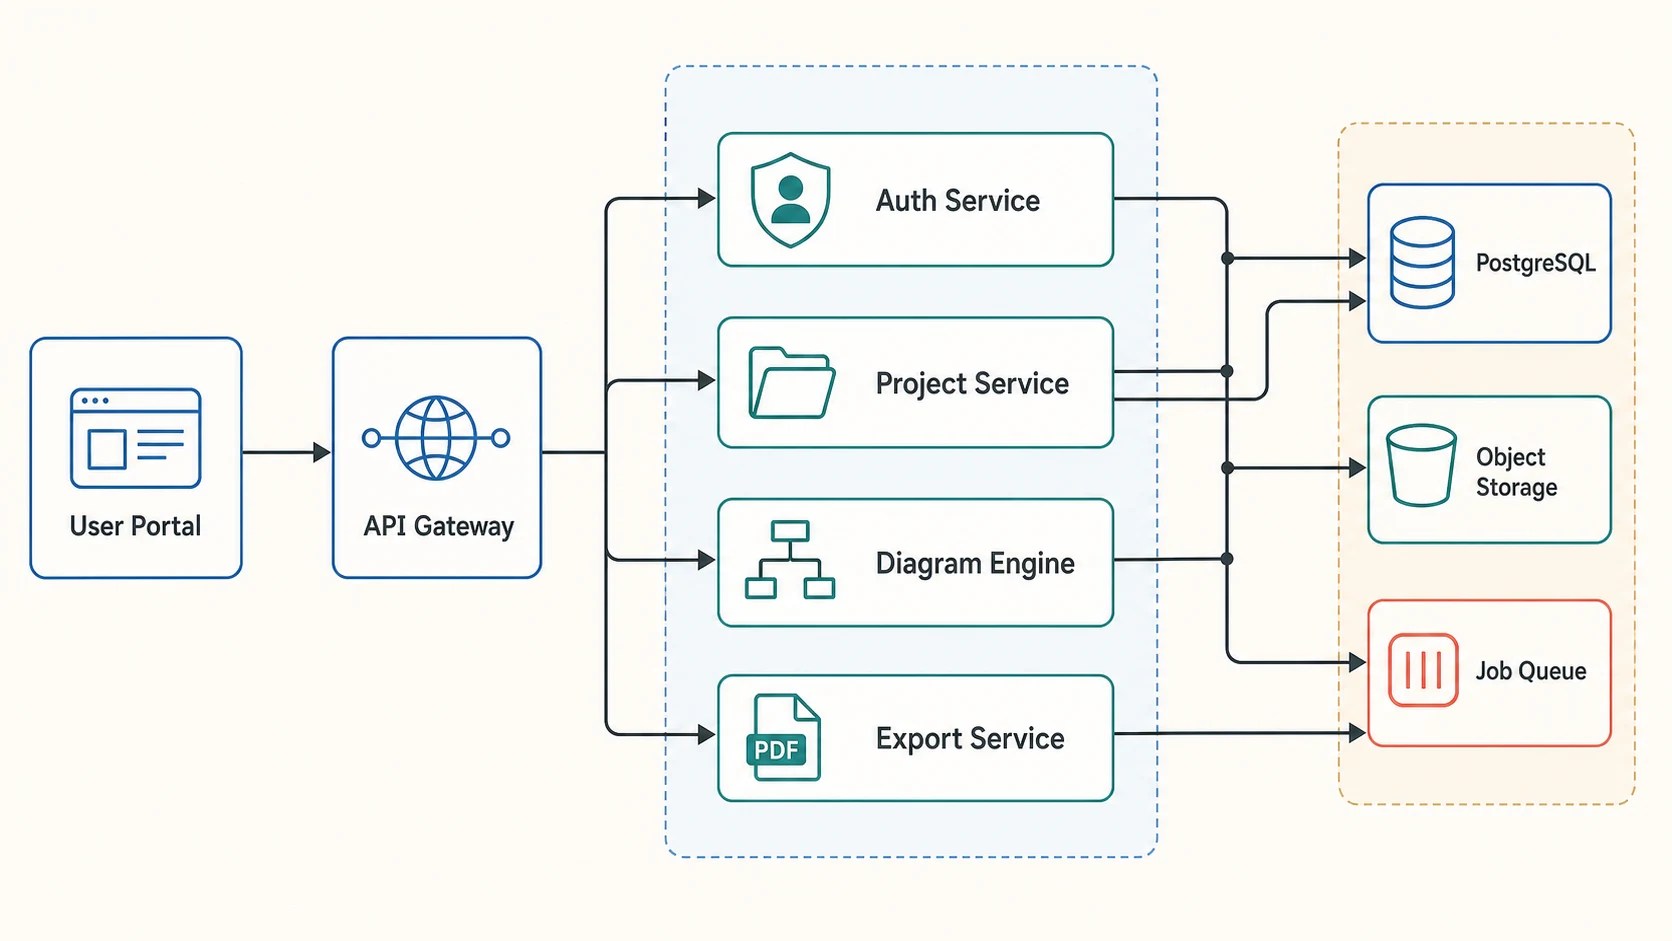
Turn plain text into an editable workflow, study design, or system diagram, then refine every label and connection.
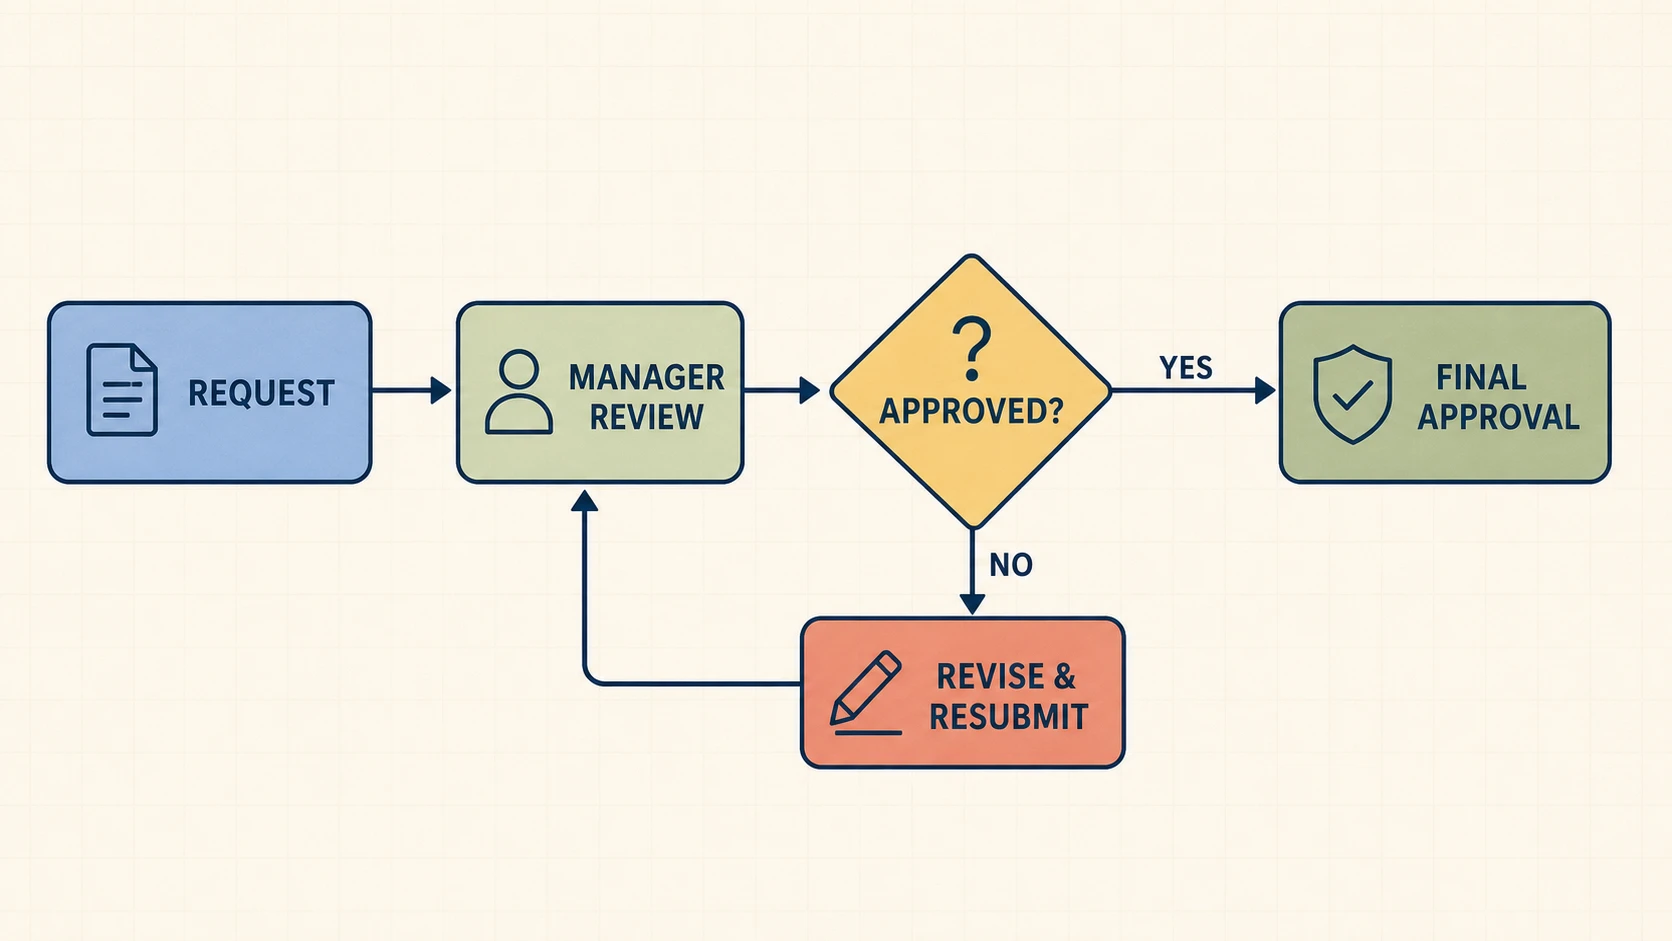
Turn a process description into an editable flowchart with explicit decisions, branches, loops, and connectors.
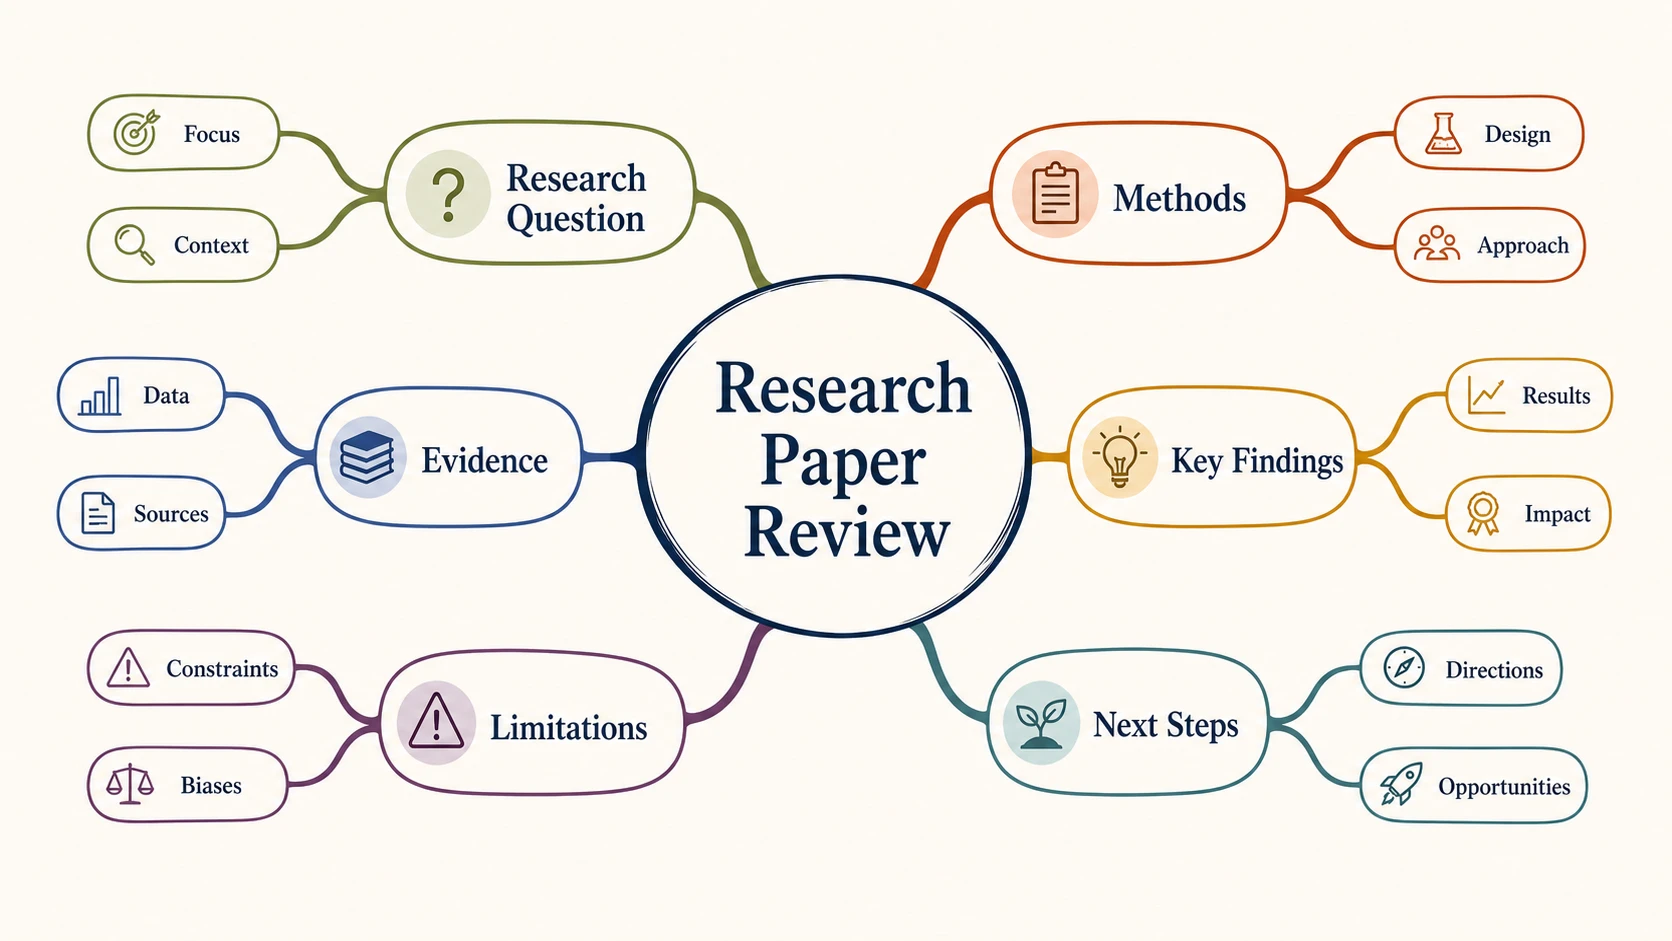
Turn text, notes, or an outline into a clear radial mind map for research, study, brainstorming, and planning.
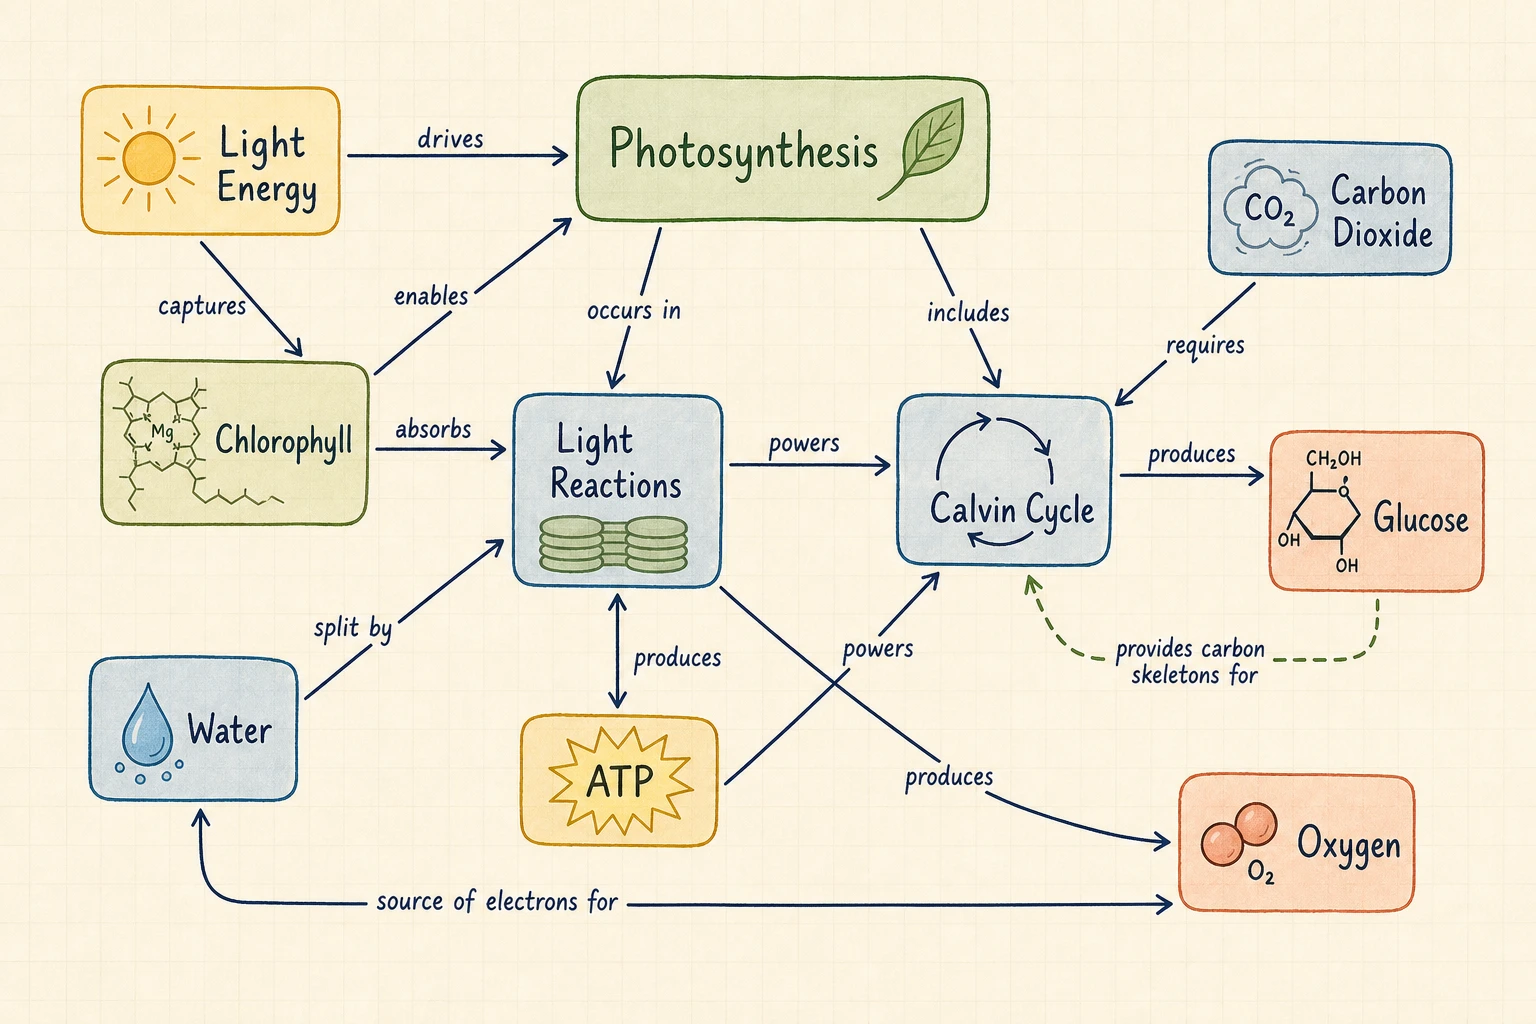
Turn a topic or text into a concept map with labeled relationships, propositions, and cross-links.
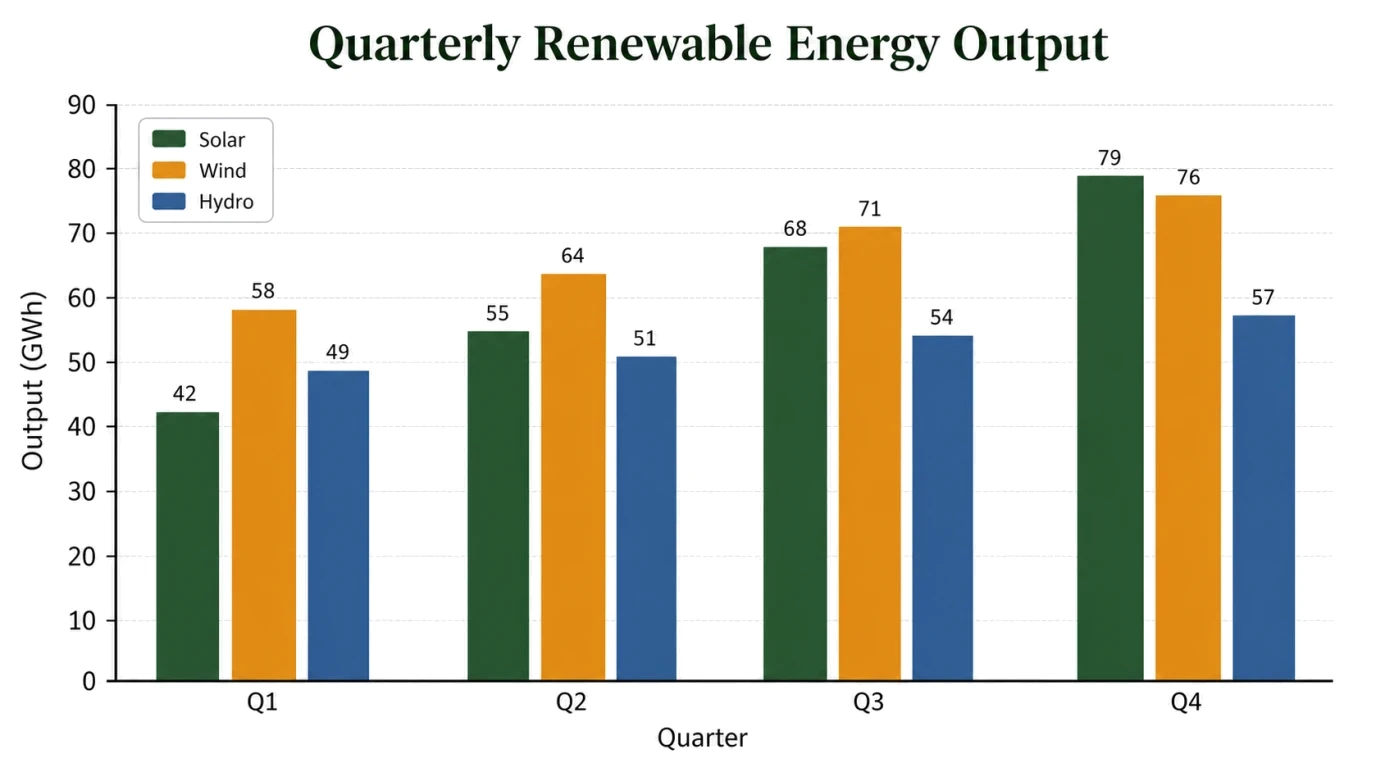
Turn pasted values or a chart brief into an editable visual draft, then review every label, scale, and annotation.
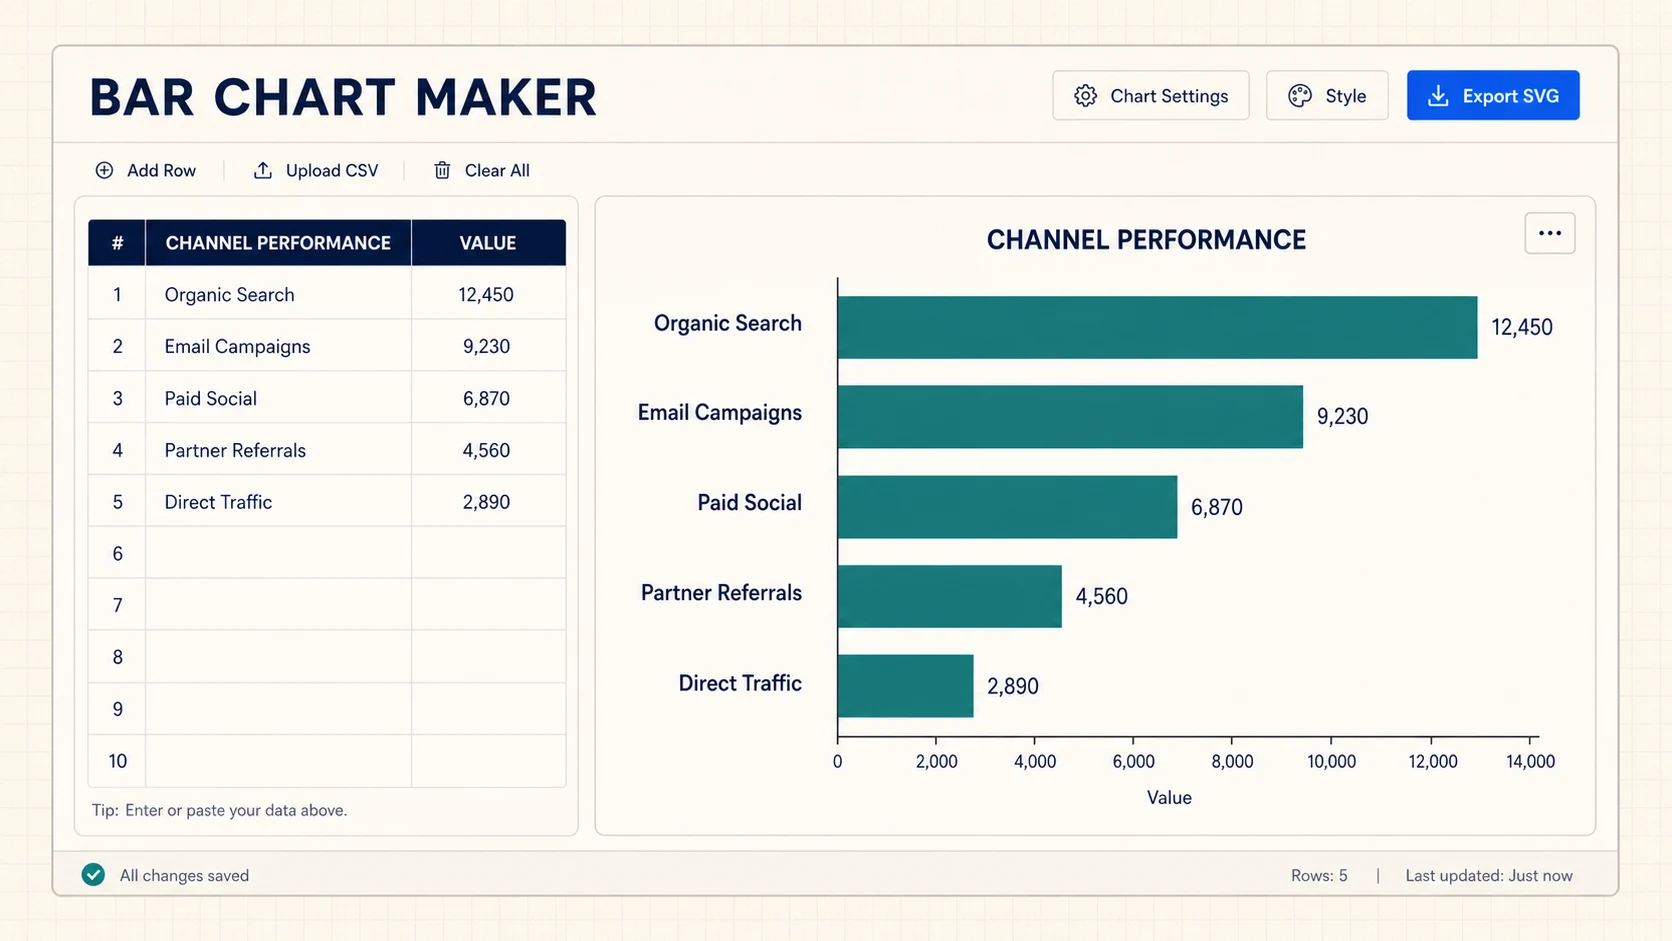
Turn CSV or spreadsheet rows into precise horizontal, grouped, or stacked bar charts, then export SVG or PNG for free.
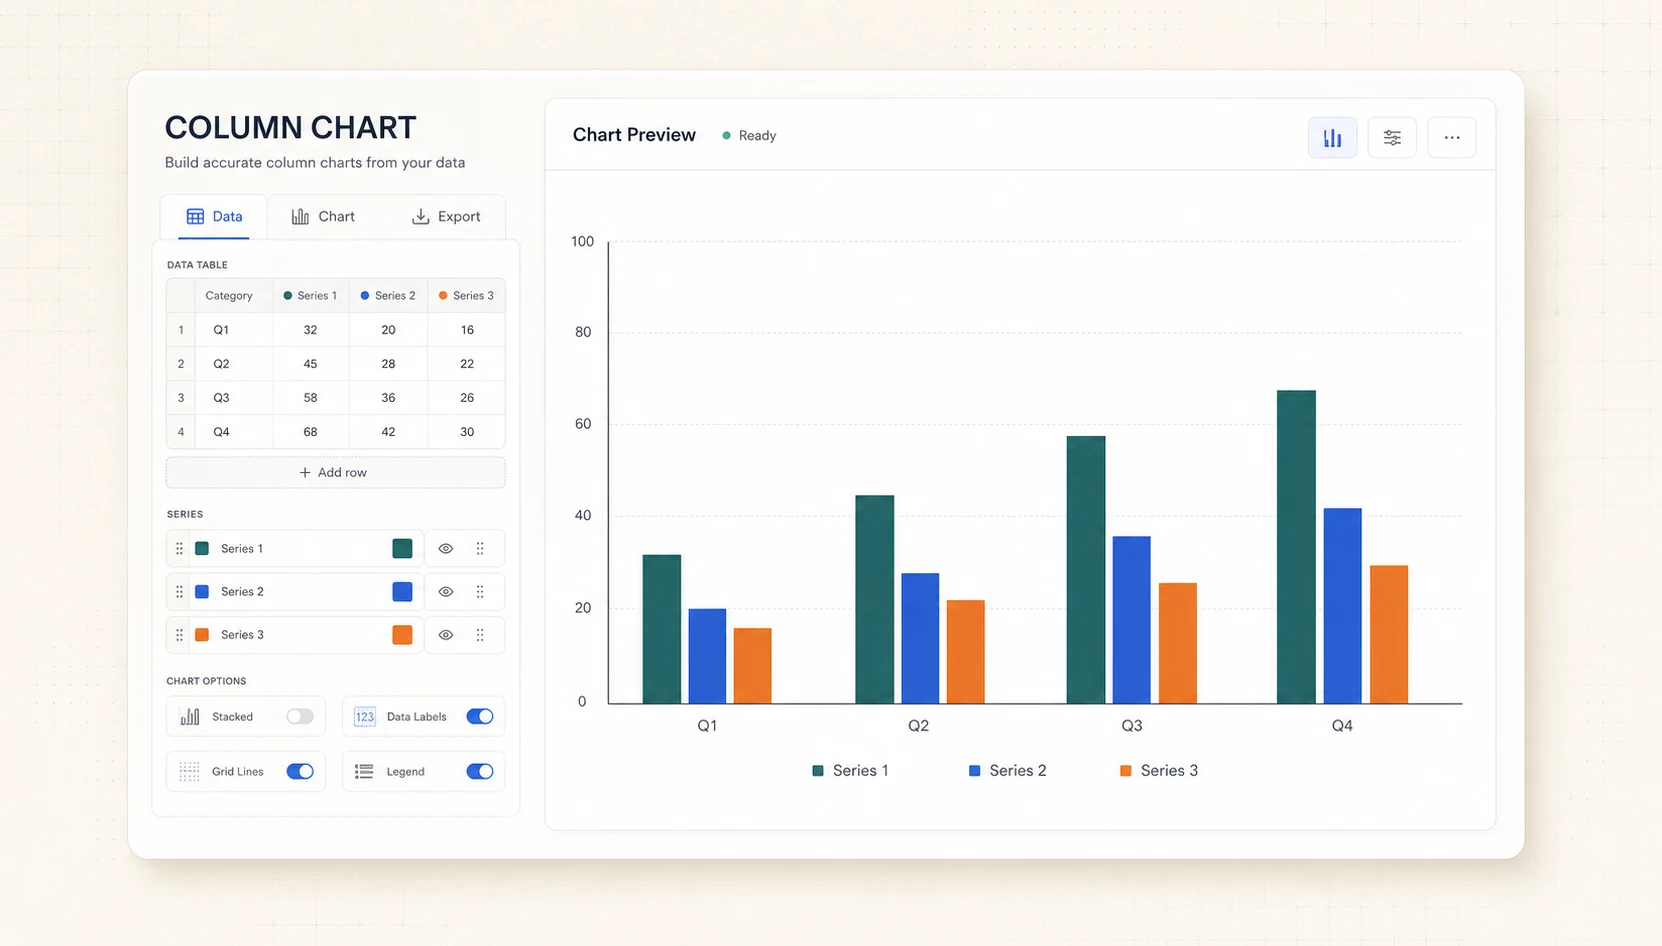
Turn CSV or spreadsheet rows into precise grouped or stacked column charts, then export SVG or PNG for free.
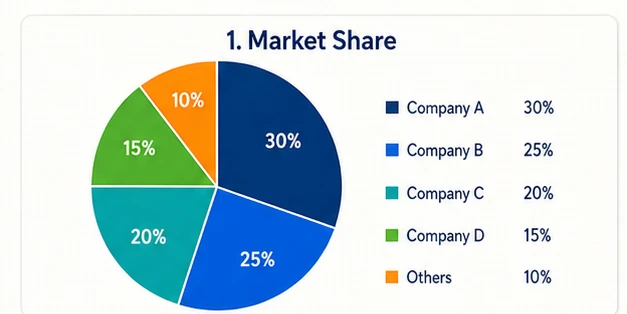
Turn pasted label-and-value rows into an exact Pie or Donut chart with automatic percentages, then export an editable SVG without sign-up.
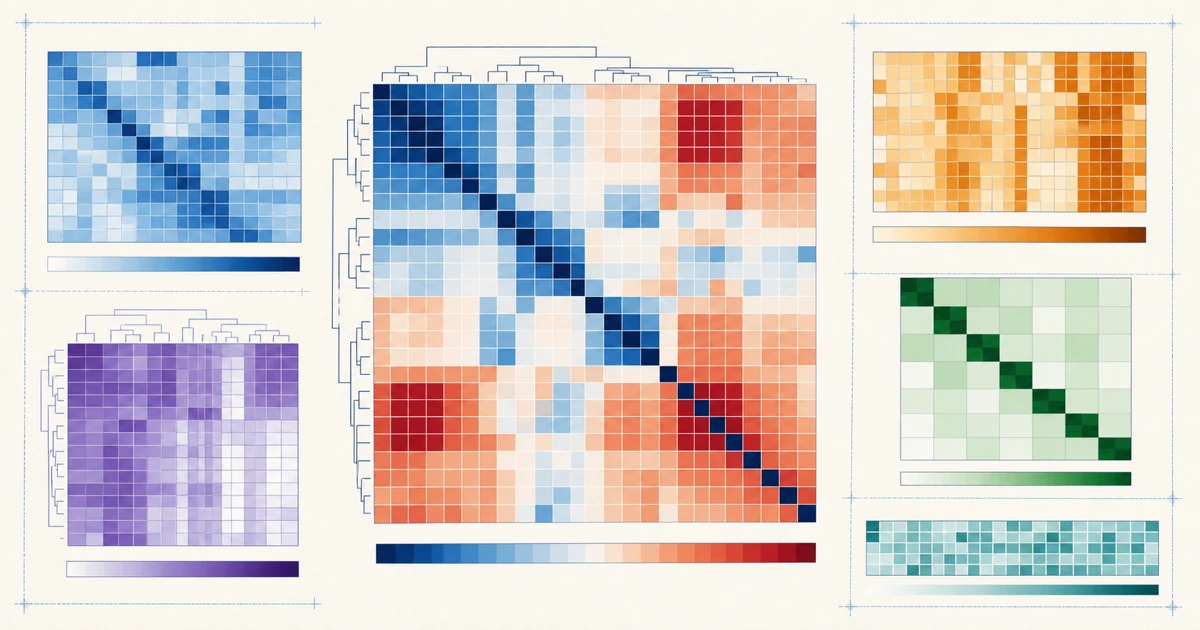
Turn a labeled matrix into an exact color heatmap with values and a shared legend, then export editable SVG or PNG.
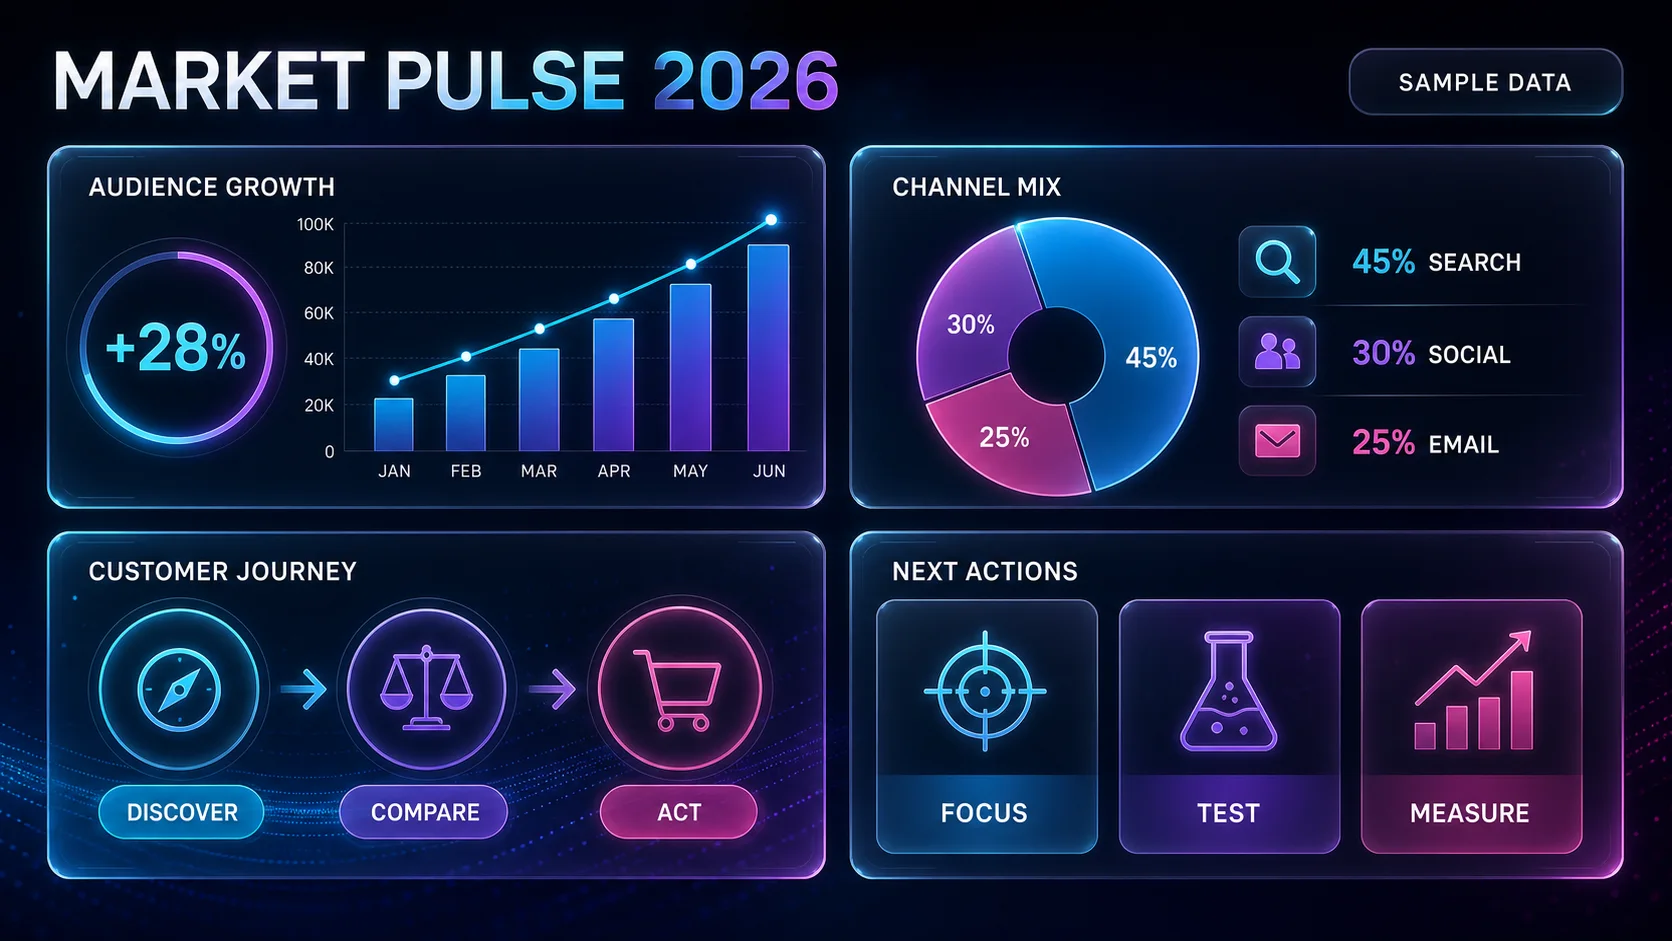
Turn text, facts, and data into a clear infographic, then refine the labels, hierarchy, and layout in FigEditor.
More focused research tools are on the way.